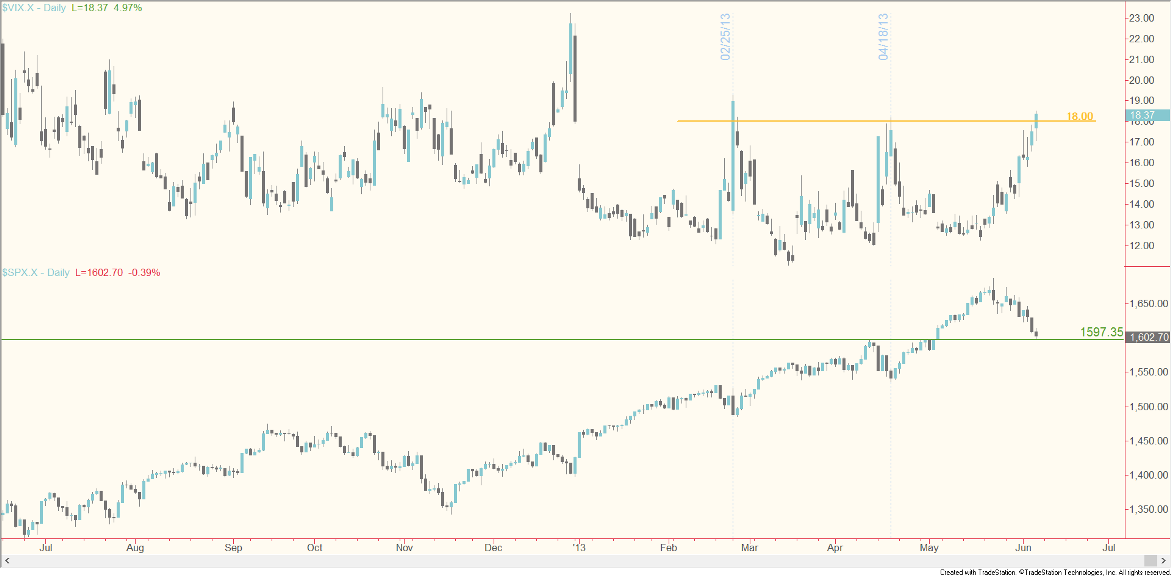
 The VIX (CBOE Market Volatility Index) has reached an extreme fear level, based on behavior this year, at the same time the S&P 500 is testing chart support at 1597.4 taken from the April high. The VIX measures fear versus complacency in the crowd by how options on the S&P 500 Index are priced. Rising trends are bearish while falling trends are bullish. Extreme readings can signal either a capitulation or a point of unsustainable exuberance. The VIX surpassed 18.00 today. The last two times this happened this year – on 4/18 and 2/25 – dips in the “500” completed. So this is a critical moment to watch since the high fear reading coincides with a test of support (see chart below). Click to enlarge the image.
This a day before the monthly labor report comes out. So what does it mean? If the jobs numbers come in just right, neither stoking speculation of the Fed scaling back stimulus soon nor striking fear about the outlook for the economy, we could see a short squeeze after the recent drop in the market. Alternatively, if stocks take out support and the VIX spikes further, I’d see an increased probability of a corrective process in stocks that involved deeper price weakness or a period of sideways activity in the near term. There’s a risk of the VIX action since early this year acting as a base, and a breakout would be consistent with the correction scenario. But one step at a time. The VIX generally doesn’t trend as easily as stocks, and what looks like a breakout can end up fizzling. Suffice it to say swing traders are better off being square ahead of the jobs numbers anyway and not drawing any big conclusions about the VIX until after we see the reaction to the news.
Twitter: @ChrisBurbaCMT and @seeitmarket
Any opinions expressed herein are solely those of the author, and do not in any way represent the views or opinions of any other person or entity.


