It’s been a rough year for investors. And very volatile.
With rising interest rates, tech (and growth) stocks have seen heavy selling. And one particular tech heavyweight has been hit hard: Verizon (VZ).
Although some might say the “technical” writing was on the wall (as the stock churned sideways forever), the stock’s swift decline has been unnerving to watch – the stock’s market cap has been trimmed by nearly $100B! Verizon is also one of the few tech dividend stocks. Down well over 30% from its 52-week high, Verizon’s dividend is now nearing 7%.
Note that the following MarketSmith charts are built with Investors Business Daily’s product suite.
I am an Investors Business Daily (IBD) partner and promote the use of their products. The entire platform offers a good mix of analysts, education, and technical and fundamental data.
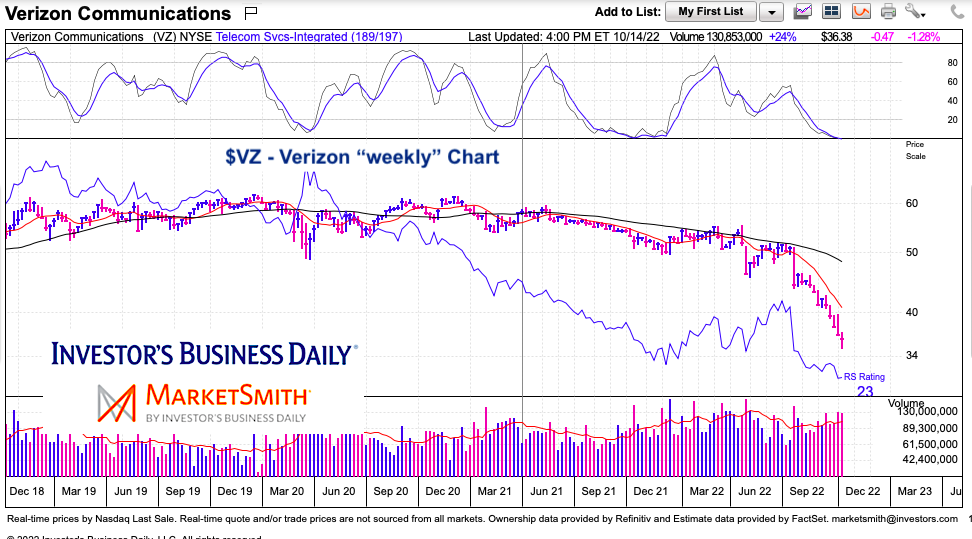
$VZ Verizon “weekly” Stock Chart
Technically, the stock is in a waterfall. In other words, the dam finally broke and price has been falling swiftly. You can see how price fell from the mid-50’s to mid-40’s before rallying back up just above 50 – this gave investor’s a false sense of security and from there the stock plummeted.
As traders often say, “don’t catch a falling knife”. But longer-term dividend investors that still believe in Verizon’s story may become interested in the stock and begin buying in increments.
Back to that waterfall… when the selling momentum finally abates, the stock will find a trading low and bounce. Momentum lows (think Elliott wave 3) are often “tradable” for a strong bounce, but then retested/broken on low volume some time down the road.
Will be interesting to see if Verizon reaches a momentum bottom in the next 2-3 weeks.

Twitter: @andrewnyquist
The author may have a position in mentioned securities at the time of publication. Any opinions expressed herein are solely those of the author, and do not in any way represent the views or opinions of any other person or entity.


