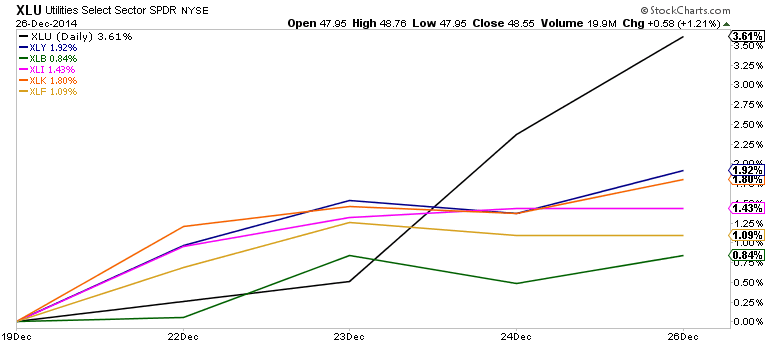
The Utilities Sector (XLU) really took the reins this past week as the market leading group. Check out the chart below showing XLU’s performance charted against various risk-on sectors.
Naturally, it’s fair to start to wonder if this just a temporary phenomenon or something more?
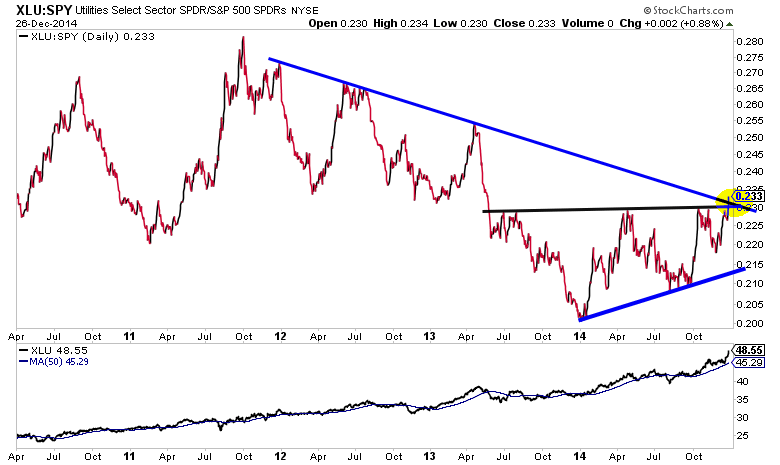
The Utilities Sector SPDR (XLU) relative to the S&P 500 SPDR (SPY) has broken a major dual resistance point. It’s cleared resistance dating back to the 2011 stock market lows and an 18 month base. If this break can sustain over the coming days, this is a monstrous change in character for the market and investors.
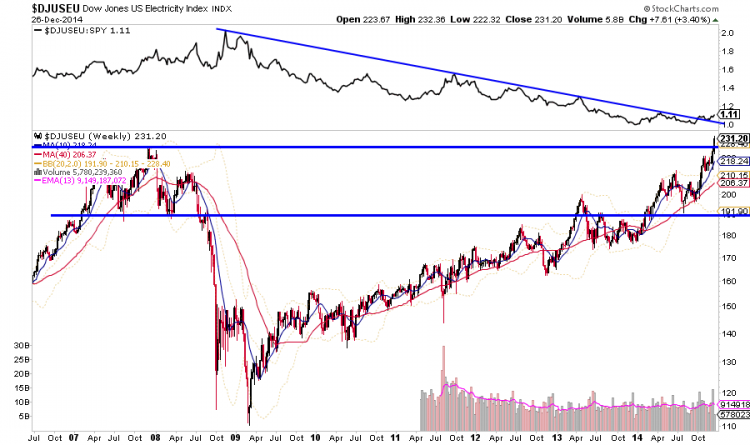
Turning our attention to Dow Jones Electricity Index, we see a relative strength breakout, as well as a back test of price resistance dating back to the 2008 crash. Again, we see more signs of a tone change.
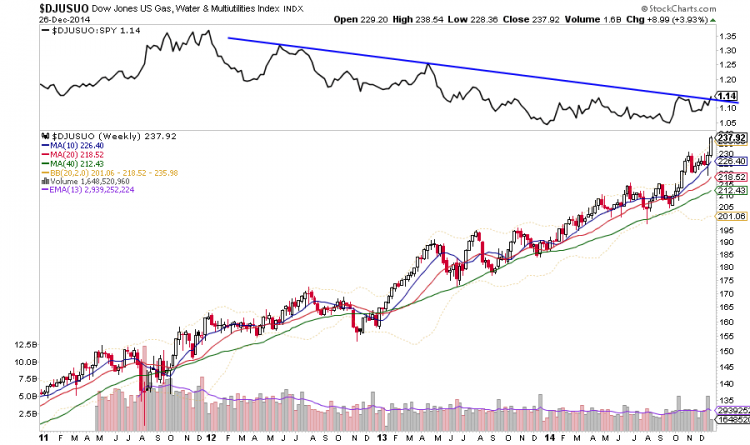
We also see the Dow Jones US Gas, Water & Multi-utilities Index breaking out of a clear relative strength downtrend dating back to 2012.
The evidence appears to be unanimous; something meaningful is going on underneath the surface. Here are a few conclusions I gather:
- Like any breakout, let’s first see if the recent breakouts hold for more than a few days
- If you’re playing a relative returns game in 2015, you might do very well being overweight the Utilities Sector (XLU).
- Long XLU Short SPY could make for an excellent pairs trade.
- Leadership in the Utilities Sector doesn’t mean this is the top right here and right now in the stock market. However, a shift change this significant deserves our full attention.
- Maybe this new found strength speaks to an increased global desire for investment grade yield.
Thanks for reading!
Follow Aaron on Twitter: @ATMcharts
No position in any of the mentioned securities at the time of publication. Any opinions expressed herein are solely those of the author, and do not in any way represent the views or opinions of any other person or entity.


