It’s been some time since I wrote about the Utilities Sector (NYSEARCA:XLU) and stocks. But it’s an important sector to watch from a risk management perspective.
It gives investors a good idea of what the climate is like regarding risk (i.e. risk-on / risk-off).
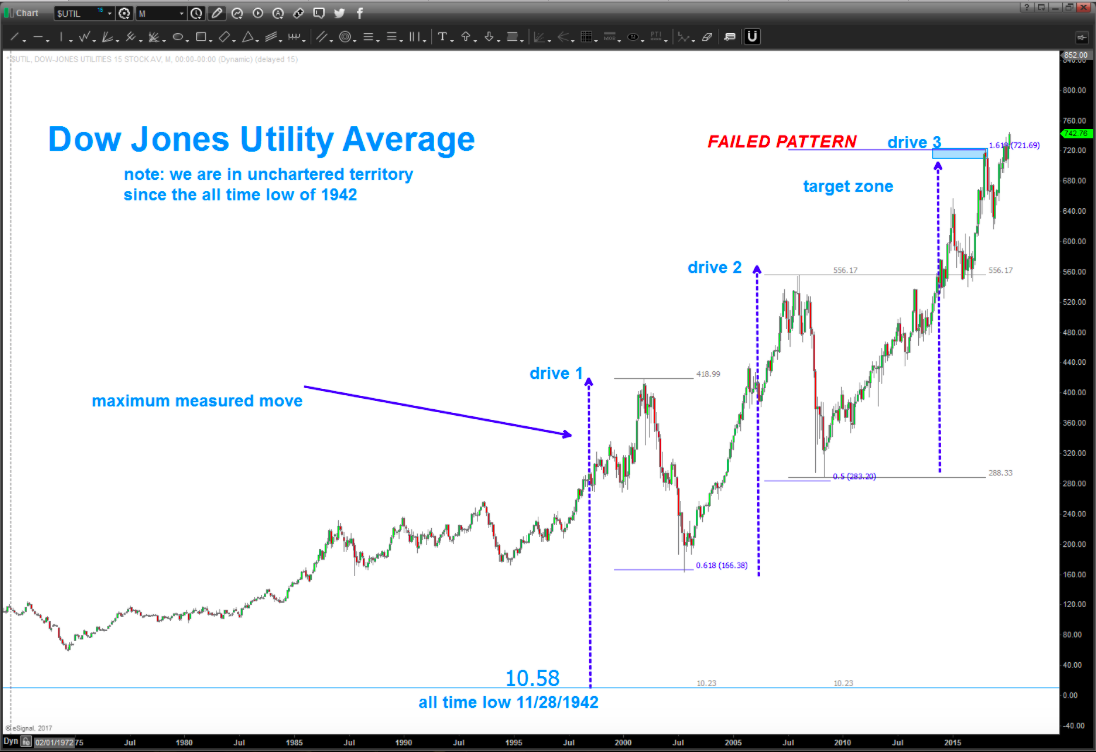
In the first chart below, you can see how the “monthly” chart pattern and original price target failed. That is/was quite surprising, but sometimes they don’t work out.
All the ingredients were there: The Dow Jones Utilities Average (INDEXDJX:DJU) was about to put in a measured move (see the blue arrows in 1st chart)) while fulfilling a 3 drives to a high pattern (and precisely at the 1.618 fibonacci extension target of the 2nd drive).
The market did end up correcting front that price target, BUT it headed higher once more… So while this price target was able to stop the Utilities Average in it’s tracks, “price” ultimately blew through this resistance. That’s important because patterns like this are typically quite strong.
Takeaway: As long as the Utilities continue to trek higher interest rates aren’t going anywhere fast.
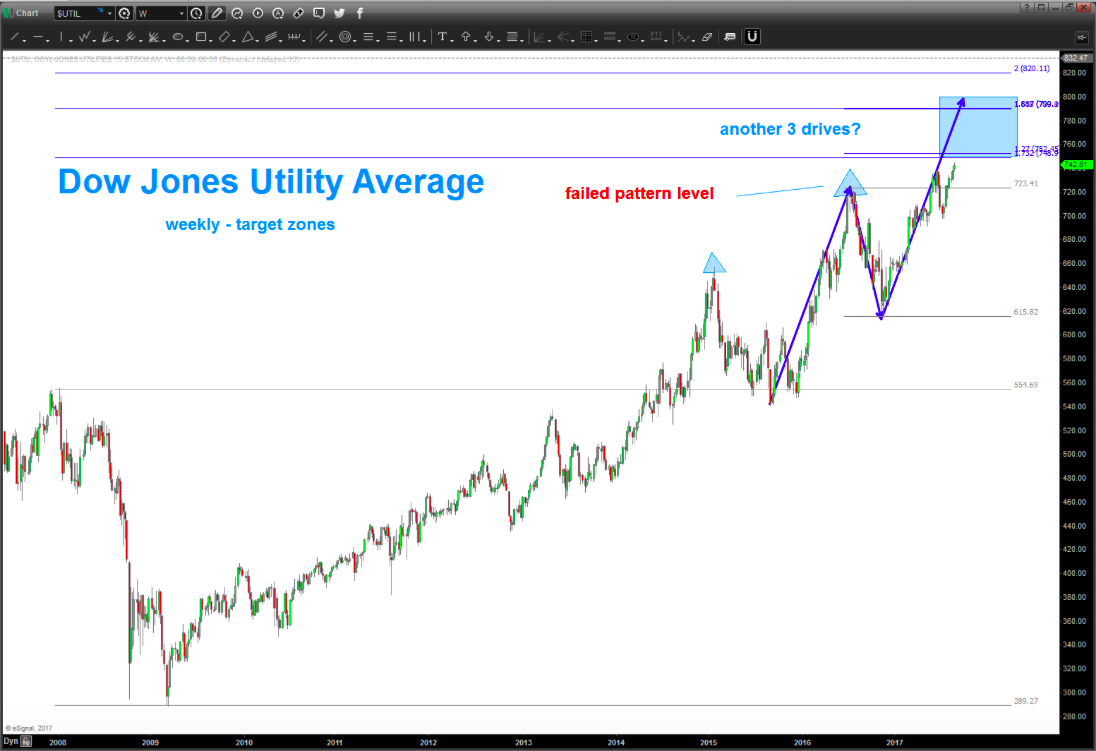
Note that I’ve included a second chart below with some NEW price targets to consider for the Utilities sector.
Here’s a look at the failed pattern:
Here’s a look at the NEW price target zone:
Twitter: @BartsCharts
Author does not have a position in mentioned securities at the time of publication. Any opinions expressed herein are solely those of the author, and do not in any way represent the views or opinions of any other person or entity.
ALSO READ: Is Apple’s Stock (AAPL) Nearing A Major Top?


