 By Andrew Kassen The beleaguered US Dollar, long forlorn of any vestige of hope by the fiscal and monetary policy-induced abasement characteristic of the last 11 years, is enjoying its strongest multi-week rally since May 2012. Yes, you heard me right, US Dollar strength.
Is this a safe-haven play (Credit: “er, yes?”; Equities: “Of course not!”)? Is the US Dollar (USD) stronger on an absolute basis, or is the Greenback merely “less bad,” evincing relative strength versus the comparatively miserable constituent contra-currencies comprising the USD Index? What’s with this USD/domestic stock correlation picking up steam over last 5 weeks, and now positive for the last two? What is that most barbarous of yellow-shiny relics telling us, if only we have ears to hear? And lest we get ahead of ourselves: in this Central Bank era of Weapons of Mass Debasement (WMD), isn’t anything smacking of a Long US Dollar thesis Don’t-Fight-the-Fed DOA; and isn’t there a disconcerting measure of complacency inherent in the act of asking such a question?
Astute market observers are taking pause here to consider the intermarket implications of a sustained, strong dollar regime brashly staring down the quasi-structural ZIRP/LSAP headwinds emanating from the Fed.
Price is a recapitulation of all of these questions. Not the answers (face it: most of these questions have no practicably obtainable answer); but the questions. Assuming the questions are worth the asking, let’s turn to the USD itself (to do this, we’ll evaluate $DX_F, the ICE US Dollar Index futures contract).
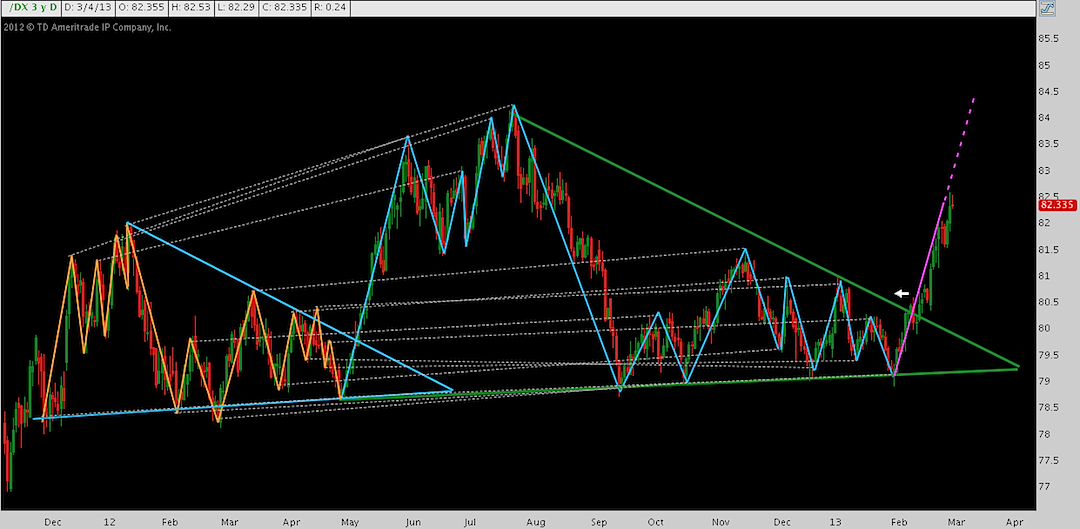
What is happening with the US Dollar has happened before; and not just the past few weeks: the last 10 months are a magnified echo of the 6 preceding that. Click US Dollar chart to enlarge.
Some charts – like this one – are more about raw feel over trenchant analysis. Here, we learn two things:
- The last 16 months have been comprised by a very orderly fractal pattern
- The latest US Dollar rally appears to be shadowing the rallies of December 2011 and May 2012.
This begs the question: is the Greenback embarking on its third iteration of this pattern; or is this time different? It’s far too early to tell.
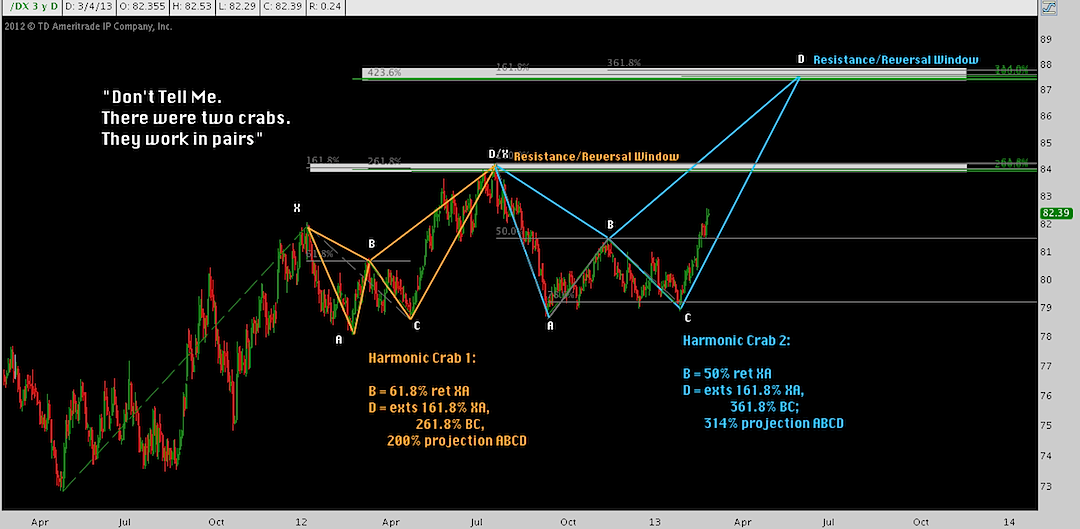
Interesting, but that correlation – remarkable though it may be – in itself just doesn’t have much utility. Fair enough: let’s peer into the fractal one level deeper. Click US Dollar chart to enlarge.
Here, the last 16 months are technically articulated with two Harmonic Crab patterns (points to whomever can identify the quote, by the way). These harmonic constructions bisect the earlier-pictured fractal differently (and are in fact a rendering of an incomplete fractal themselves). In this context, the USD’s present 5-week rally isn’t a venture off into the unknown, but the beginning of leg CD of the larger Crab and not even halfway to its target between 87-88.
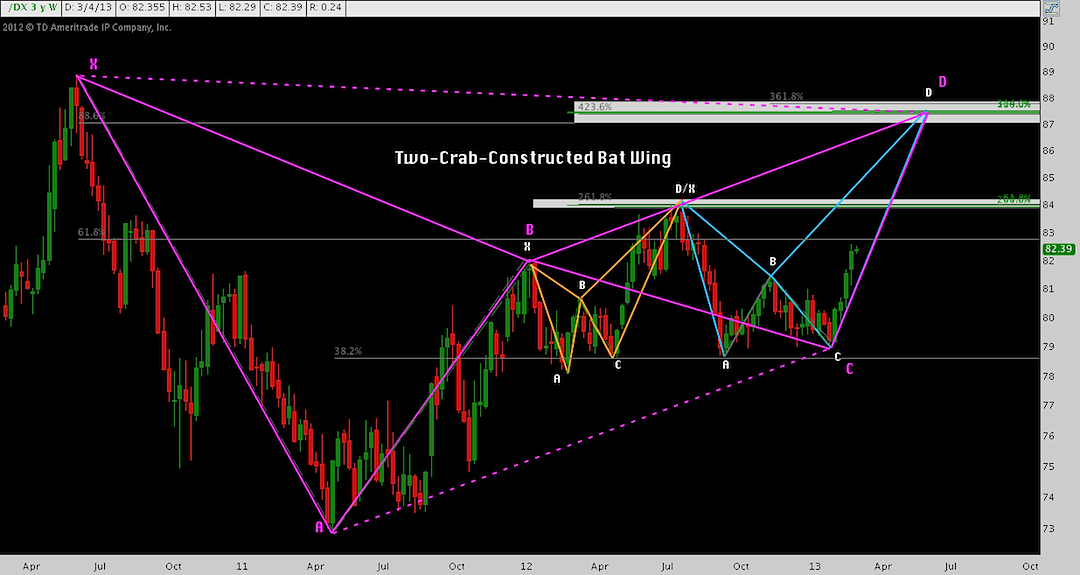
Zooming back out (note we’re now moving to a weekly timeframe), this Two-Crab thesis is well-supported by a larger Harmonic Bat construction. Click US Dollar chart to enlarge.
I’m the first to admit that’s a weird title…. In any case: the Bat calls here for a move to the 88.6% retracement of X (in purple), creating reliable context and aligning well with the general 87-88 resistance/reversal window set out with the larger crab above.
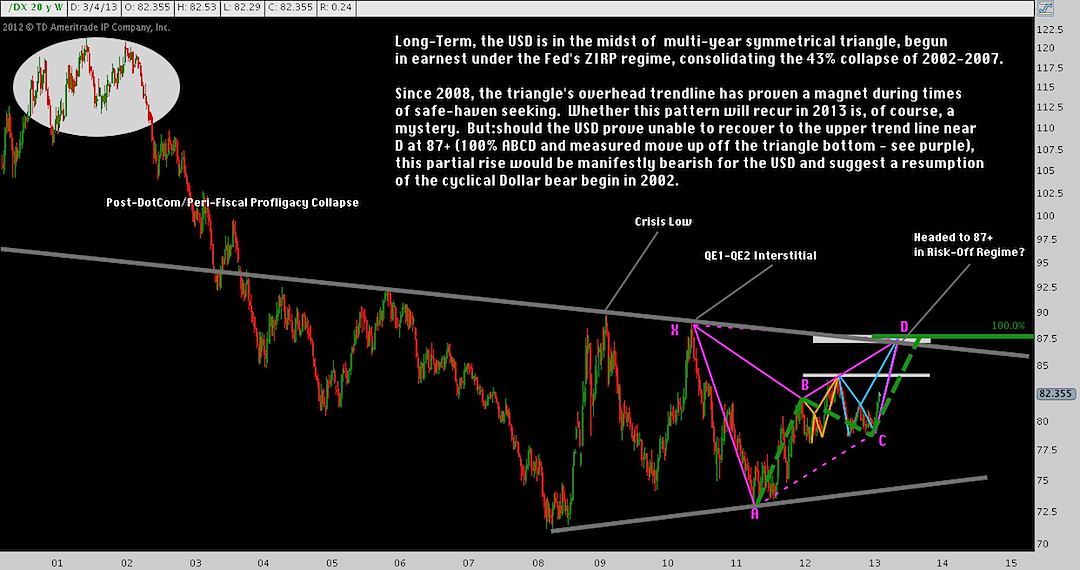
It’s beginning to seem like a lot is coming together here at 87-88, eh? Let’s now move even further out. Click US Dollar chart to enlarge.
As it turns out, 87-88 is in confluence with the descending trend line of the US Dollar’s multi-year symmetrical triangle (converging gray lines). That is a truly impressive pattern that really presses home the benefit of looking left and across multiple timeframes.
As the accompanying chart notes explain in further detail, presently the USD is mid-way through an intra-triangle upswing. This triangle trend line overhead acts both as a magnet and massive resistance, suggesting (along with completion of the larger Crab and Bat patterns at D) the Greenback’s climb to it – a shred of hope, then – may be the prevailing USD theme of 2013’s first half.
Twitter: @andrewunknown and @seeitmarket
No position in any of the mentioned securities at the time of publication.
Any opinions expressed herein are solely those of the author, and do not in any way represent the views or opinions of any other person or entity.

