In today’s post, I share some high level insights on the U.S. stock market indices and important sectors.
Several are tied to an annotated chart image to help illuminate my thoughts.
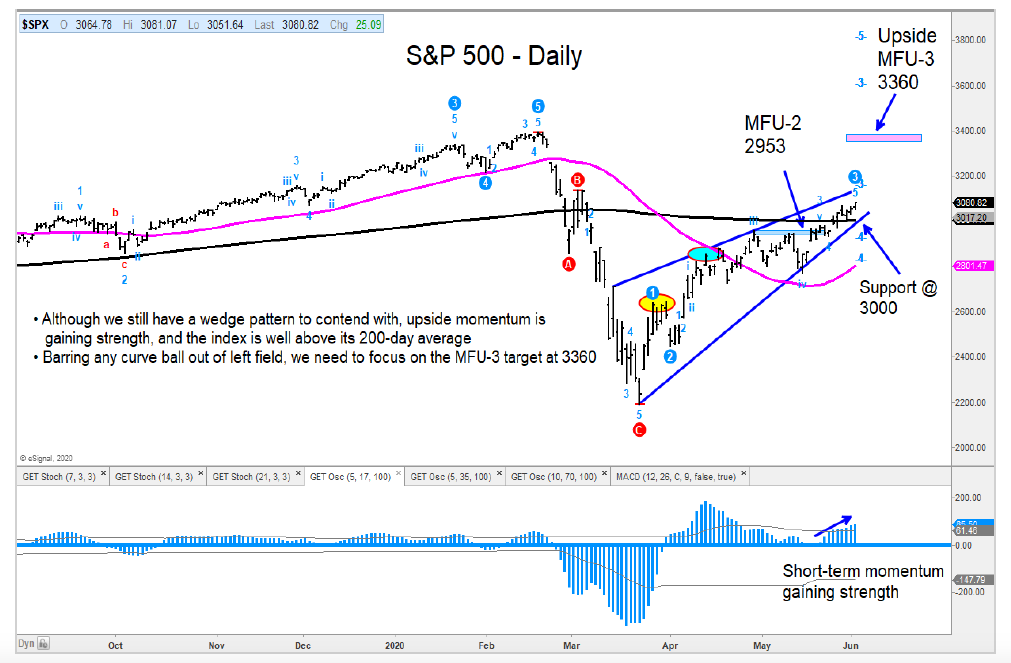
The S&P 500 is well above its MFU-2 (Money Flow Unit) price level and has cleared its 200-day moving average.
I still have an upside MFU-3 price target at 3360 from here.
S&P 500 Index “daily” Chart

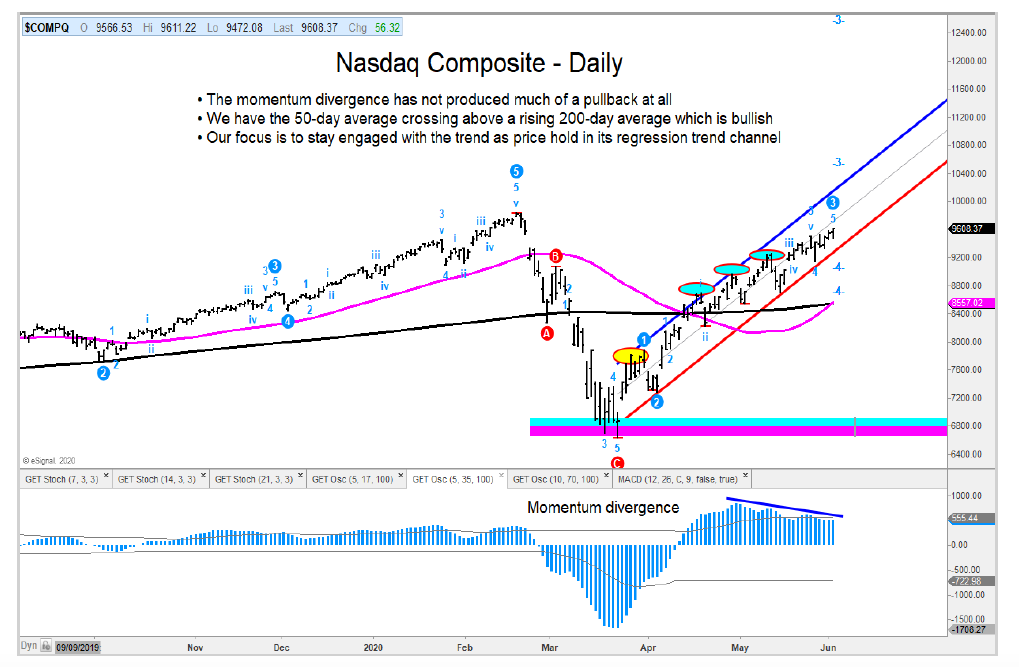
The Nasdaq Composite has its 50-day moving average crossing above its rising 200-day moving average which is positive. We are using the weekly regression trend channel for its next price target area.
Nasdaq Composite “daily” Chart

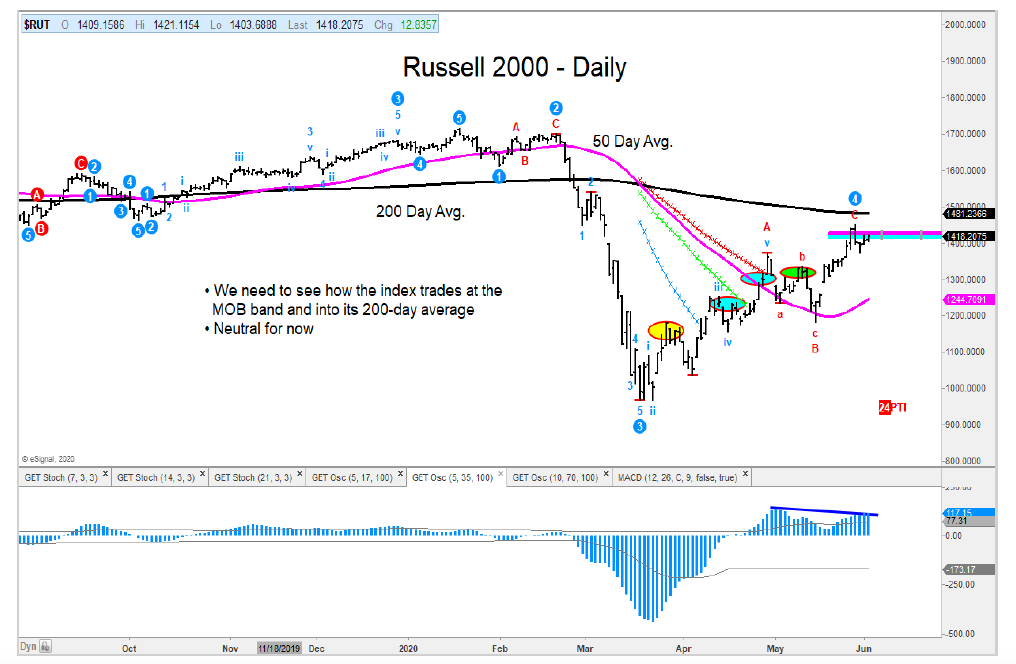
The Russell 2000 needs to clear a big price resistance area just ahead of where the stock index is now. I am on the sidelines waiting to see how the index trades into this zone.
Russell 2000 “daily” Chart

We have the Mid-Caps (MDY) clearing above a MOB band which is positive. This recent move higher has generated an MFU-3 price target just under the 2018 high.
I highlighted the relative performance of the Momentum Factor ETF (MTUM) relative to the S&P 500 Low Volatility ETF (SPLV) last week when the ration reversed from our MFU-3 target. There is a downside Money Flow Unit-2 that is targeting a decline into its 50-day moving average.
The Consumer Discretionary sector for the U.S. and global basis has jumped up in our ranking to number 3 behind Technology and Health Care. This would be a good area to look for long ideas.
The author may have position in mentioned securities at the time of publication. Any opinions expressed herein are solely those of the author, and do not in any way represent the views or opinions of any other person or entity.


