U.S. stocks rose last week as economic data continues to support a strong U.S. economy. For the week, the S&P 500 (NYSEARCA: SPY) rose 2 percent.
Last week a better-than-expected March labor report reassured investors that the economy continues to grow and that wage growth, which moved down to 3.2% from 3.4% in February, indicates a noninflationary environment.
Manufacturing and construction are booming and two areas that held the U.S. in check last year, housing and auto sales, have reversed and show strong numbers.
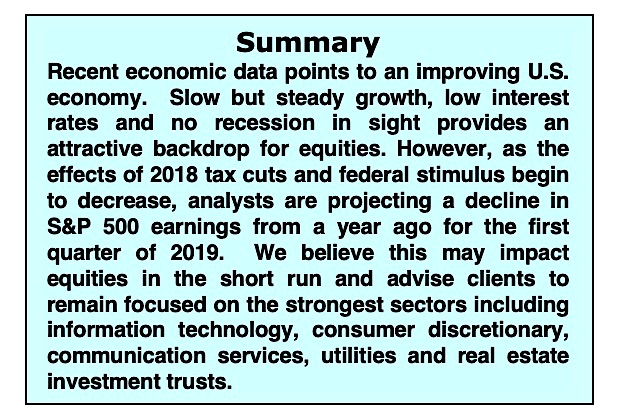
The focus of attention will now fall on the corporate earnings data. Analysts are projecting estimated earnings in the first quarter of 2019 for the S&P 500 will decline 4.2% from a year earlier according to FactSet.
Although the profit outlook should improve in subsequent quarters, the potential for margins to be squeezed due to rising costs including higher wages, rising commodity prices and a stronger dollar could weigh on overall profits.
Investors now have to weigh a healthy economy, moderate growth, and the Federal Reserve’s pledge not to raise interest rates this year against a decline in first-quarter profit numbers and volatile China/U.S. trade headlines.

We would stick with the strongest sectors of the market which continue to be defensive sectors.
The area showing the most improvement is the consumer discretionary sector. This follows reports that consumer confidence rose to a five-month high in March and Labor Department statistics show strong wage numbers. Information technology remains the leading sector followed by defensive areas including communication services, utilities and real estate.

Strong gains last week in the S&P 500 and Dow Industrials spread to other areas of the market including the NY Composite Index that is made up of more than 2000 stocks. This is an indication that stock market breadth is beginning to catch up with price gains.
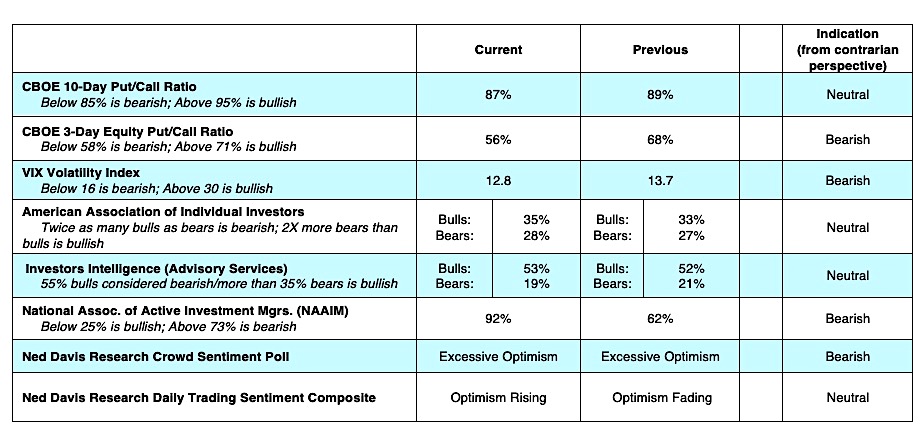
Nevertheless, entering the new week, stocks after rallying for 73 days without a meaningful pullback (3%), are overbought. According to Ned Davis Research, this is far beyond the historical median of 15 days before a pullback occurs. The uninterrupted rally has not gone unnoticed as measures of investor sentiment show optimism approaching levels considered excessive.
This is seen in the precipitous drop in the demand for put options the past two weeks (investors buy puts in anticipation of a market decline) and the drop in the CBOE Volatility Index on Friday to levels last seen near the highs for the S&P 500 Index on October 3 at 2922.

Additionally, the Ned Davis Global Sentiment Composite indicates the highest level of optimism on record since 2002 and the NDR Crowd Sentiment Composite exhibits the most optimism since early October. Rising optimism is also seen in the latest data from the National Association of Active Investment Managers (NAAIM). The recent NAAIM report shows the managers nearly fully invested at 93% equities versus 25% at the lows in December. Using contrary opinion, the increase in investor optimism could open the door for a pullback over the near term.
Twitter: @WillieDelwiche
Any opinions expressed herein are solely those of the author, and do not in any way represent the views or opinions of any other person or entity.


