Credit Spreads (cont.)
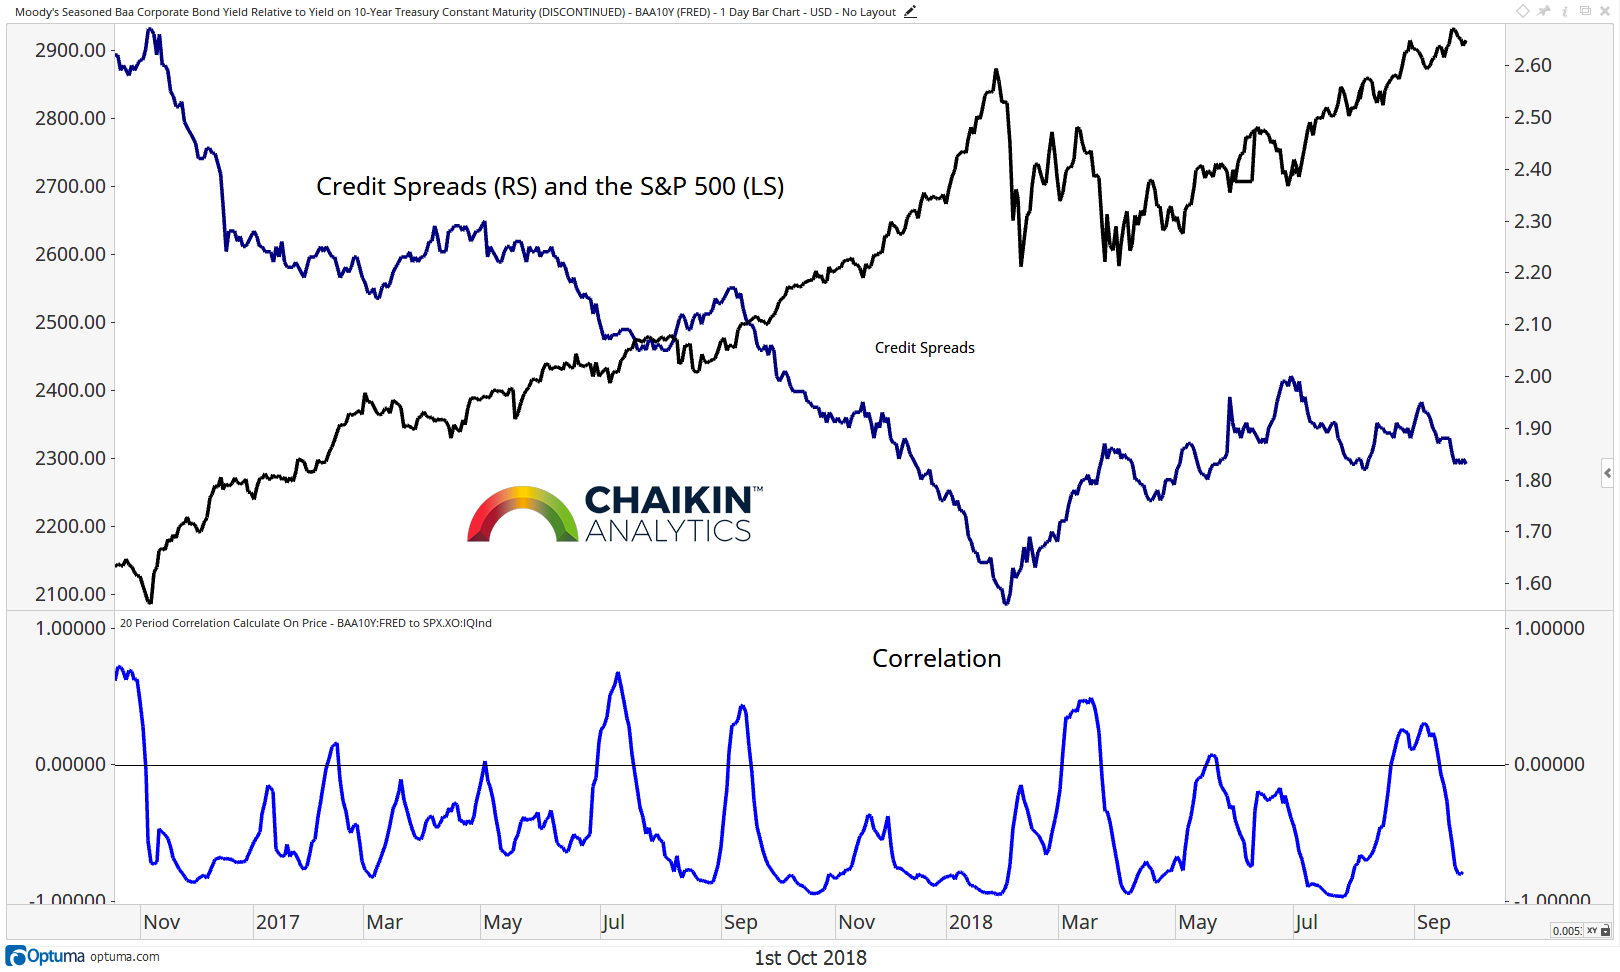
Here we can see that the spread between BAA-rated bonds and the 10-year yield has moved slightly lower over the past week.
There is generally a negative correlation between this spread and the S&P 500. Given that, this is a metric we will continue to watch on a weekly basis.
Commodities
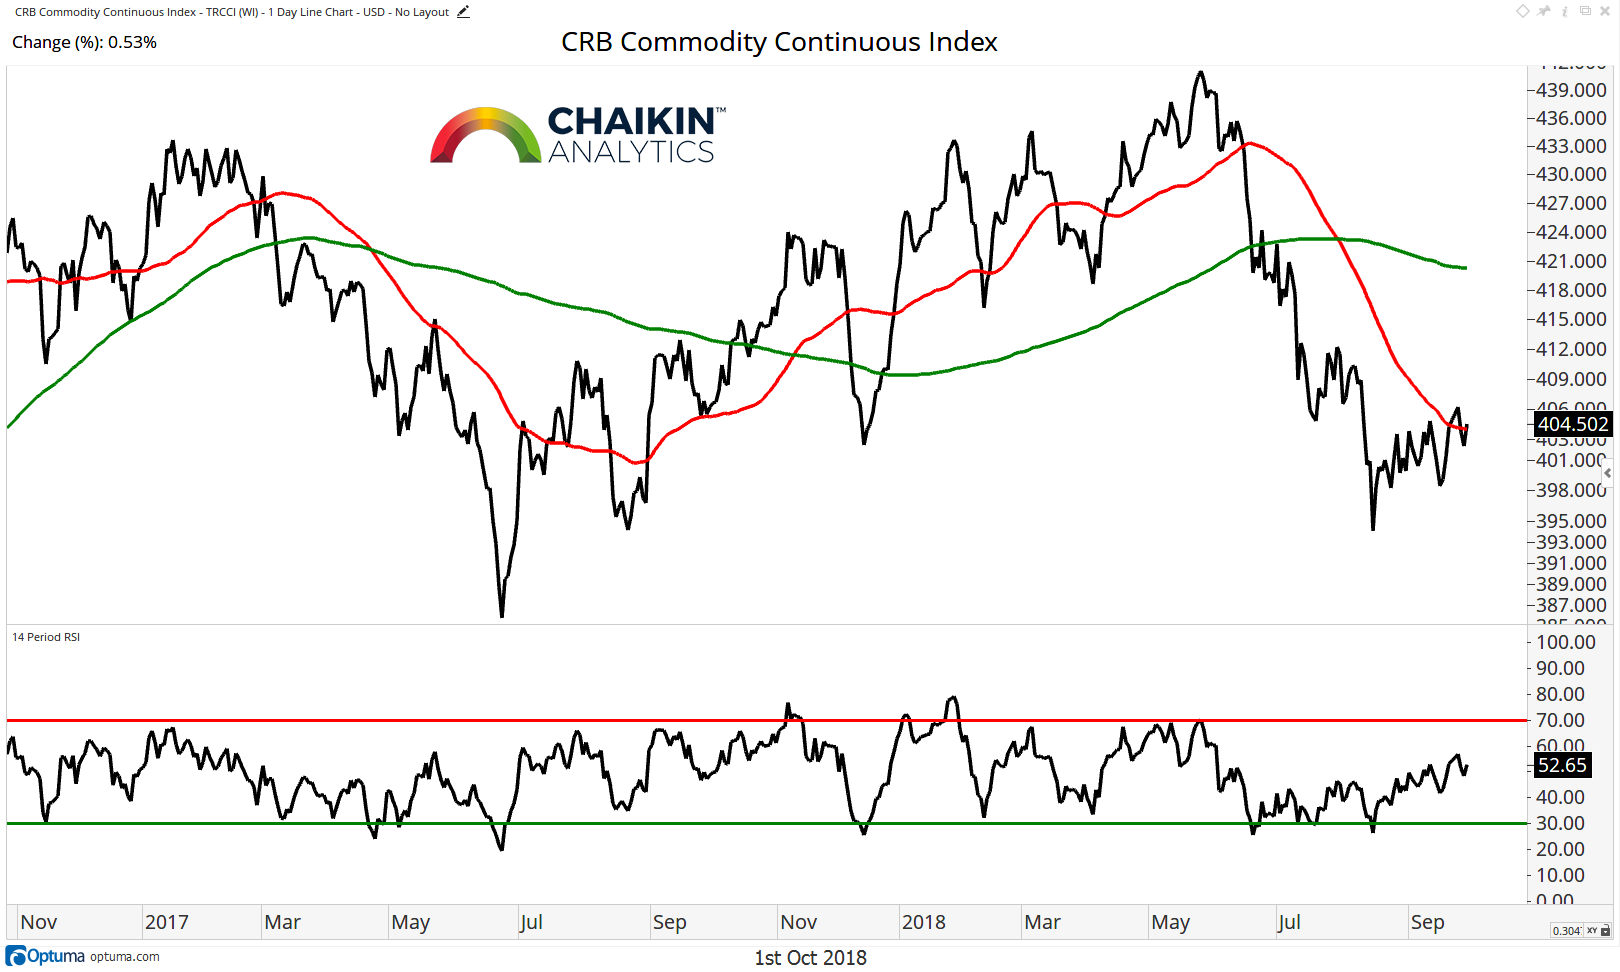
The CRB Commodity Index was flat last week. The index has met the 50-day moving average but remains below the 200-day moving average. The RSI has shifted to bearish ranges, confirming the weakness in the price trend since the highs in May.
Despite the rally last week, the trend remains lower. Continued commodity weakness should have a negative impact on the Materials sector.
The Dollar
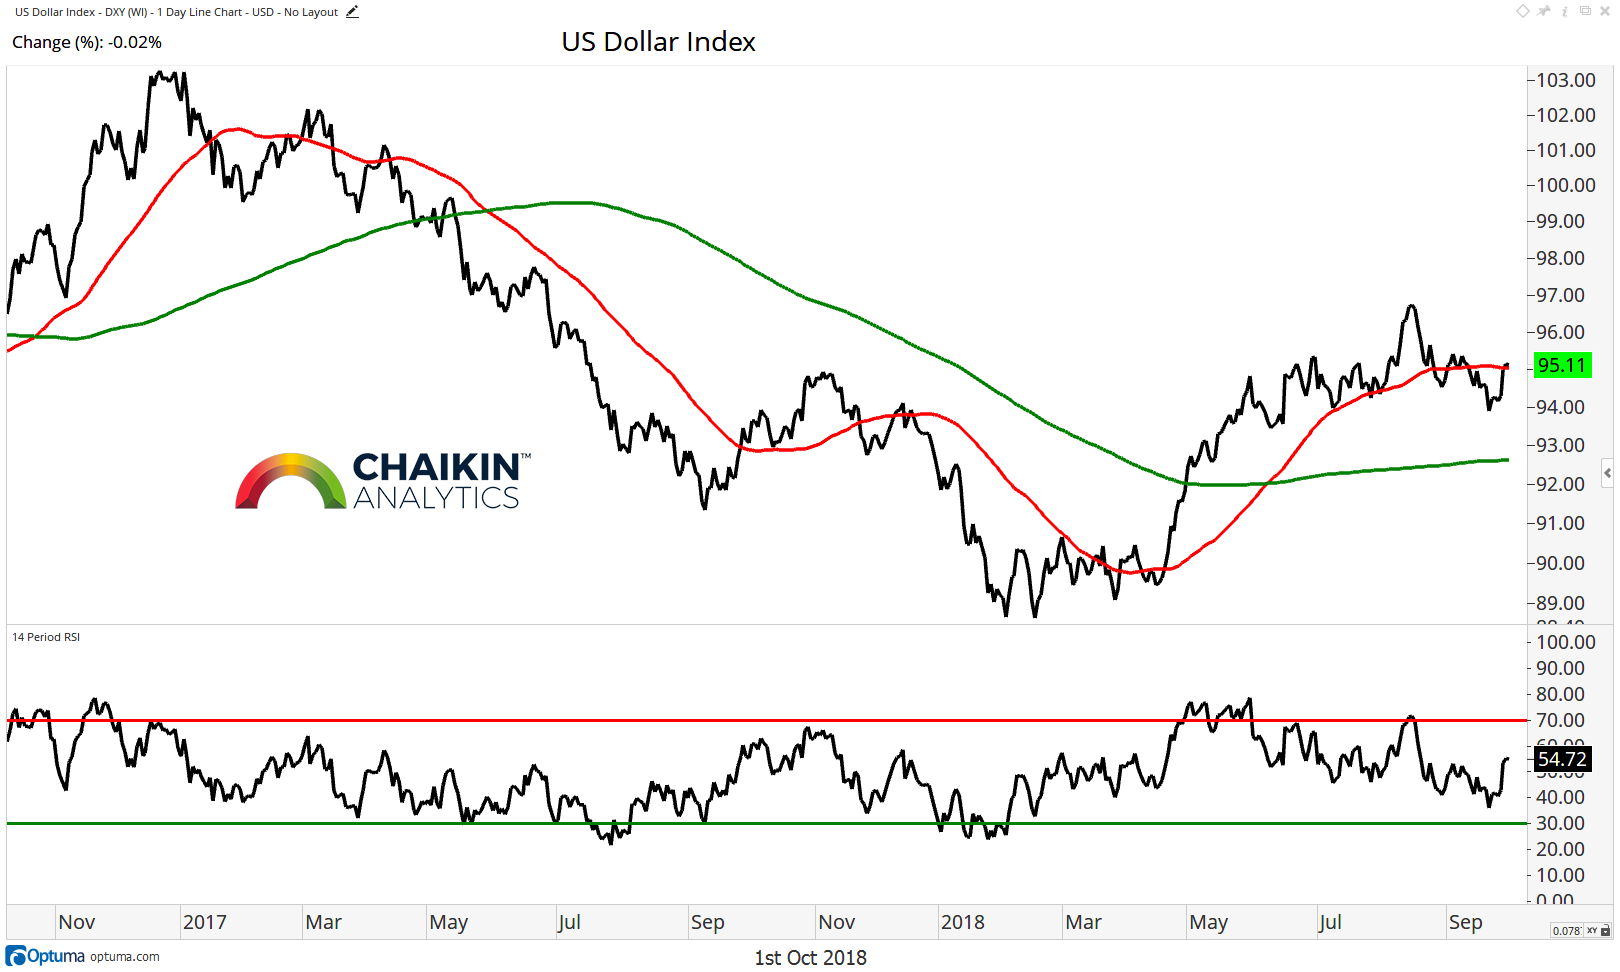
The Dollar Index has rallied back to the 50-day moving average and remains above the 200-day moving average. The RSI has rallied from the lower bound of bullish ranges and has not been oversold since early 2018. A break of the August highs is needed to confirm that the uptrend for the dollar remains in place.
Twitter: @DanRusso_CMT
Author may have a position in mentioned securities at the time of publication. Any opinions expressed herein are solely those of the author, and do not in any way represent the views or opinions of any other person or entity.


