The US Dollar has the attention of the global financial markets, especially the commodities sector. Just check out the action in Grains, Oil, and Precious Metals. Earlier this week, I highlighted the weakness in Gold and Silver. Surely a function of a stronger US Dollar.
So, is the US Dollar setting up for another move higher? Let’s see what the chart is telling us and check in on some key Fibonacci levels.
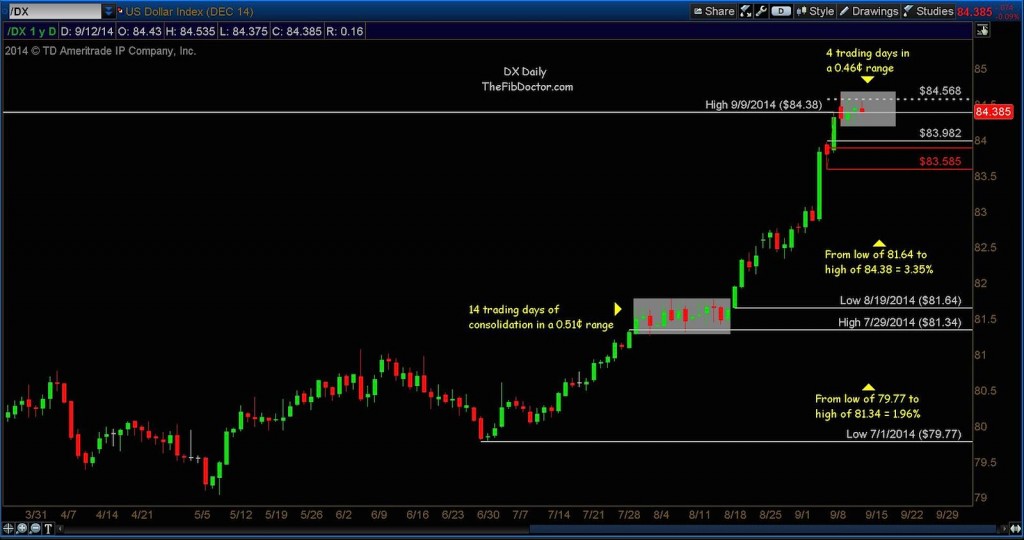
Here are some highlights and takeaways from the US Dollar chart posted below:
- From the low of 79.77 on July 1, 2014 to the high of 81.34 on July 29, 2014 the Dollar increased by 1.96%.
- The Dollar then consolidated for the next 14 trading days in a 0.51 range.
- From the low of 81.64 on August 19, 2014, to the high of 84.38 on September 9, 2014 the Dollar increased 3.35%.
- The Dollar is currently consolidating again, so far in a 0.46 range.
It will be important to see if the US Dollar Index can consolidate once again over the coming days. This will be interesting to watch to say the least.
US Dollar Daily Chart
Follow Dave on Twitter: @TheFibDoctor
No position in any of the mentioned securities at the time of publication. Any opinions expressed herein are solely those of the author, and do not in any way represent the views or opinions of any other person or entity.


