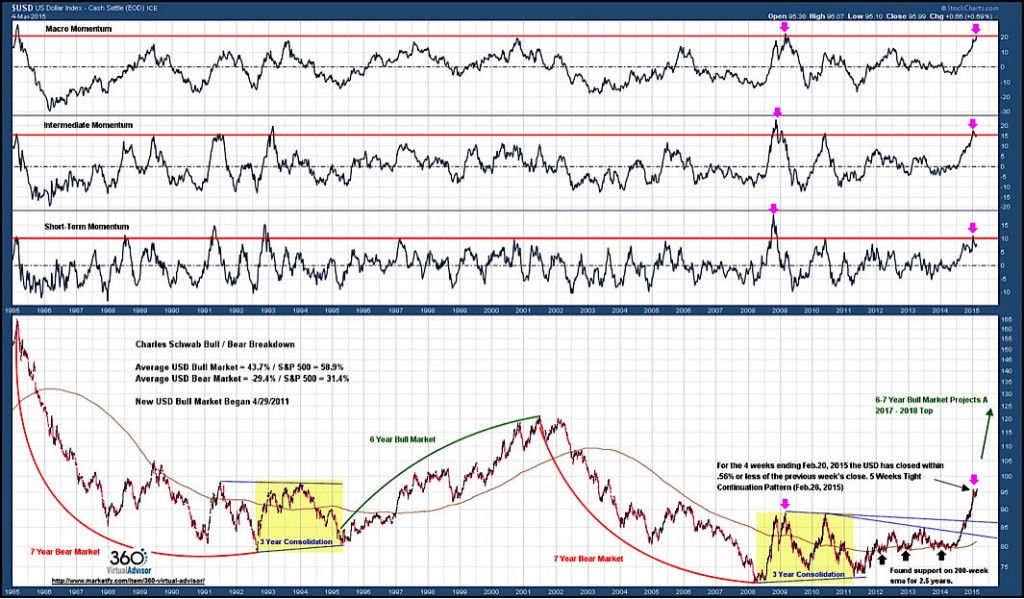
The US Dollar secular bull market began in the second quarter of 2011. During 2012, 2013 and early 2014 the currency successfully tested the 200-week simple moving average (sma) on several occasions as the long-term moving average flattened after the 7-year bear market from 2001-2008. Since mid-2014, investors have seen a strong USD rally with a breakout above the 2009 and 2010 highs, the 1985 / 2001 trendline and the 200-month sma.
Currently the US Dollar is breaking out from a 5-Weeks-Tight continuation pattern that was defined in the weeks ending February 20, 2015. In the weekly chart below the Macro, Intermediate and Short-Term momentum oscillators show an extremely overbought condition as the new breakout is developing. A similar reading on all three time intervals occurred at the 2009 high.
US Dollar – Weekly Chart
It has been my view since early 2012 that the US Dollar secular bull market began in 2011 and I project that the bull market will run into at least 2017-2018. In the short-term, the USD will likely continue the breakout from a 5-Weeks-Tight continuation pattern, but the extremely overbought condition will take hold in the next few weeks and usher in the first meaningful correction since the beginning of the US Dollar secular bull market. The magnitude and duration of the US Dollar correction should be mitigated by the beginning of the interest rate normalizing process in mid-2015.
I currently hold no long or short position in the U.S. Dollar. You can gain further access to my research, trade recommendations, and model portfolio at 360° Virtual Advisor Live. Thanks for reading.
Follow Sheldon on Twitter: @hertcapital
No positions in any of the mentioned securities at the time of publication. Any opinions expressed herein are solely those of the author, and do not in any way represent the views or opinions of any other person or entity.


