The US Dollar currency has rallied sharply over the past year.
Is it time to give King Dollar his crown back?
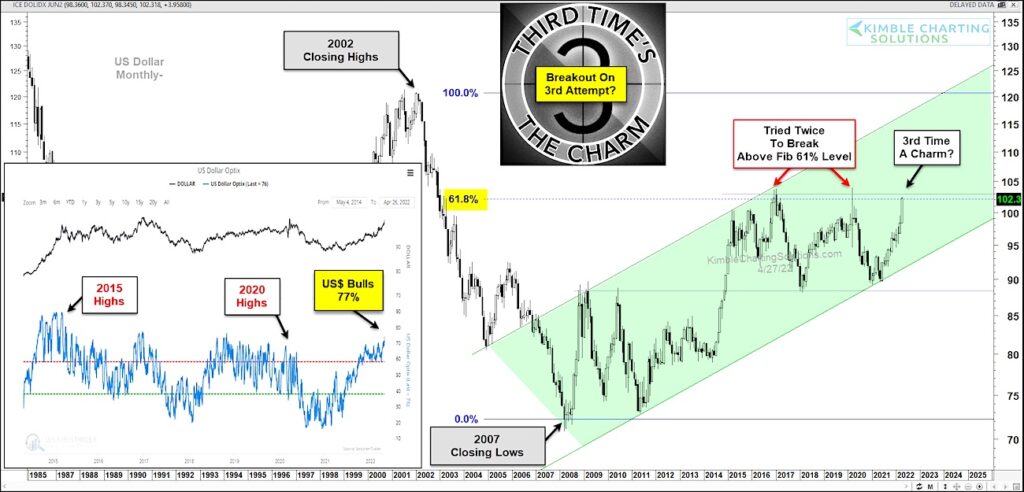
Looking at today’s long-term chart, we can see that the US Dollar has traded in a broad rising channel since the 2007 low. And the 2015 and 2020 highs formed right at the 61.8% Fibonacci retracement of the 2002 high to 2007 low.
Well, here we are again… the rally in 2022 has King Dollar back at the 61.8 Fib and attempting to breakout to new highs for the third time. US$ bulls are elevated at 77%. Could that slow down the buck here again?
Or will the third time be a charm for King Dollar? Stay tuned!!
US Dollar Currency Index “monthly” Chart

Note that KimbleCharting is offering a 2 week Free trial to See It Market readers. Just send me an email to services@kimblechartingsolutions.com for details to get set up.
Twitter: @KimbleCharting
Any opinions expressed herein are solely those of the author, and do not in any way represent the views or opinions of any other person or entity.
Editors update (April 28 10:55 am central standard time): Fixed mis-spelling from “Kind” to “King”.


