As we continue to follow the US Dollar Index and Invesco DB U.S. Dollar Index Bullish Fund NYSEARCA: UUP, we wanted to alert readers that price has now declined into the central area of the Elliott wave support zone we showed in September.
Conditions look quite good for a sizable bounce. Our contrarian view is that the US Dollar can even rally to new highs.
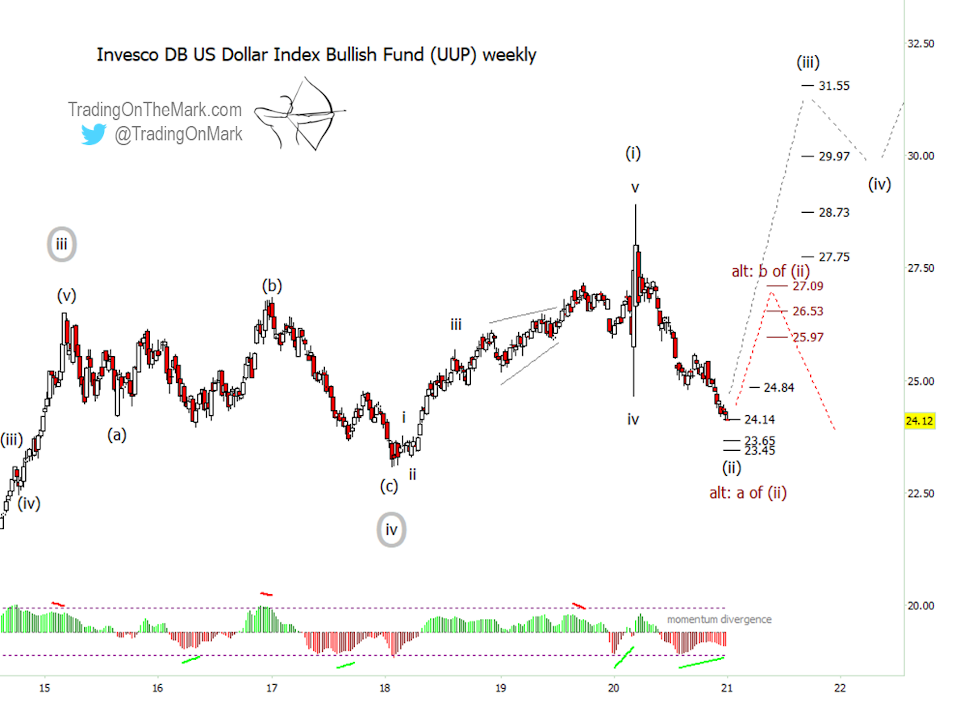
Recall we believe the US Dollar is trying to climb impulsively from its January 2018 low, which we believe represented large corrective elliott wave [iv] (shown circled on the chart). An impulse up from that area would consist of five waves, with upward wave (i) and downward wave (ii) possibly being completed. That sets the stage for a strong upward wave (iii), or an alternate but still bullish scenario of an upward correction in the case that wave (ii) isn’t finished yet.
The updated “weekly” Elliott wave chart below shows newly refined support levels at 24.14, 23.65 and 23.45 (based on fibonacci and Gann techniques) that could mark the completion of the current decline. If price attempts a bounce from that zone, then we would want to see a weekly close above 24.84 as confirmation of an upward reversal.

With an upward wave (iii) as our primary scenario, we have preliminary targets marked at 29.97 and 31.55 for UUP. If that scenario unfolds, then we might also expect price to struggle a little bit to overcome lower resistance at 27.75 and 28.73. All of those levels come from standard Fibonacci extension measurements.
In the alternate and slightly less bullish scenario, a bounce from the present area could represent just the middle part of wave (ii). Many traders would still find a bounce of that magnitude appealing. If price appears to be “noticing” the standard fibonacci retracement levels at 25.97, 26.53 and 27.09 during its climb, that would lend weight to the alternate case.
Keep in mind, US Dollar bulls want to see UUP find support above its January 2018 low. Bears would view a break of that area as confirming their expectations for further downward movement in coming years.
It’s common for reversals in currencies to take place near the turn of the year. In addition, the momentum indicator for UUP is showing a prominent bullish divergence signal compared to price right now.
Trading On The Mark provides detailed, nuanced analysis for a wide range of markets including crude oil, the S&P 500, currencies, gold, and treasuries. To celebrate the end of 2020 we’re offering a special 20% price reduction for all subscriptions begun before January 15. The coupon code is “holly”. See our website for details.
Twitter: @TradingOnMark
The authors may have a position in the mentioned securities at the time of publication. Any opinions expressed herein are solely those of the author, and do not in any way represent the views or opinions of any other person or entity.


