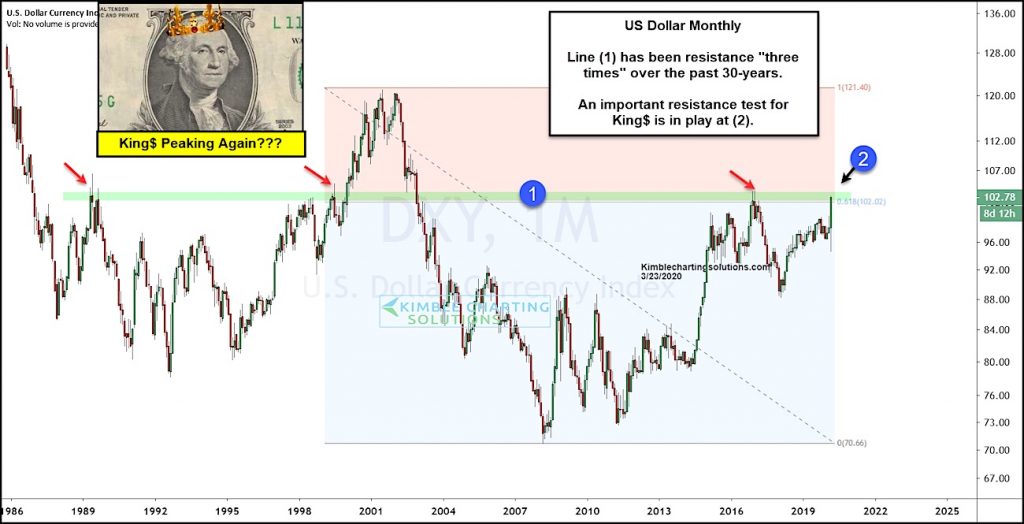
US Dollar Index “monthly” Currency Chart
The past month has seen global stock markets crash, volatility erupt, and investors flee to the US Dollar in a “flight to quality” move.
A recent ten day period captures the magnitude of this move: From the March 9 low at 94.61 to the March 19 high at 103.82, the US Dollar Index surged 9.7%!
King Dollar is now testing an important long-term band of resistance at (2), marked by the trading highs of 1989, 1999, and 2017 – see line (1).
How the Dollar fares at (2) could be quite telling for the markets.
Will another peak form as panic selling subsides? Or will King Dollar push higher, indicating further turmoil? Stocks, commodities, and inquiring minds want to know. Stay tuned!
Note that KimbleCharting is offering a 2 week Free trial to See It Market readers. Just send me an email to services@kimblechartingsolutions.com for details to get set up.
Twitter: @KimbleCharting
Any opinions expressed herein are solely those of the author, and do not in any way represent the views or opinions of any other person or entity.


