When the US Dollar Index and the related ETF (UUP) fell through the support levels we mentioned in our post last May, it signaled that the correction needed more time to complete.
Further declines during the summer caused us to revise our Elliott wave count somewhat, but the pattern still favors a resumption of the larger bullish trend.
In this post, we offer two scenarios for the Power Shares DB US Dollar Bullish ETF (NYSEArca: UUP). Both scenarios suggest bullish opportunities in coming months and also during the next two years. You can find an even more detailed analysis in our next newsletter.
US Dollar ETF: Watch These Supports For Your Next Trade!
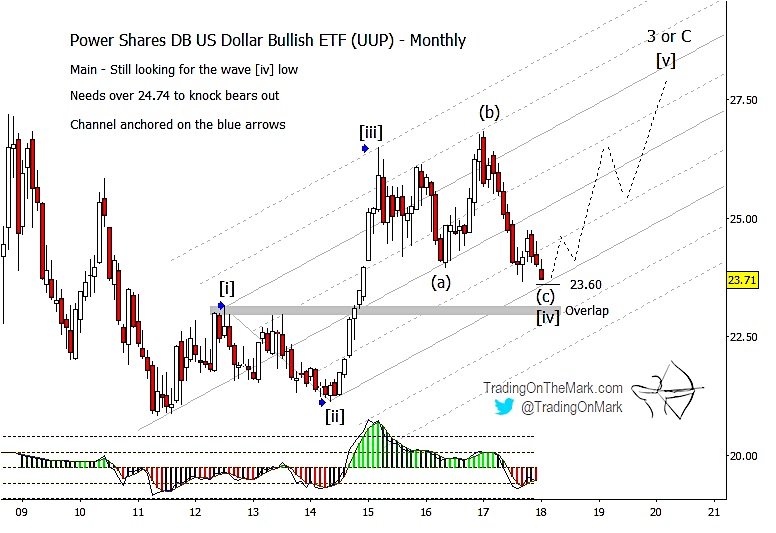
Our main scenario for UUP still has price climbing in a large five-wave structure from the 2011 low. When price fell below important support near 25.08, that suggested the fourth wave in the structure still had more work to do. Now price is approaching a Fibonacci extension and channel support near 23.60 for the final part of corrective wave [IV].
If the support kicks in as expected, price should then rise in a smaller but still sizable five-wave structure to reach new highs. On the monthly chart below, we have drawn the future path as an impulsive wave (no overlap), but an upward diagonal pattern is also possible. Cycles analysis for the Dollar Index (not shown) suggests a low near the present time and a high sometime near the middle of 2019.
The lowest UUP may go while keeping the main scenario alive would be the area of the highest weekly close during 2012 – or near approximately 22.98. Beneath that level, wave [IV] would overlap wave [I], which would dictate a revision of the entire count.
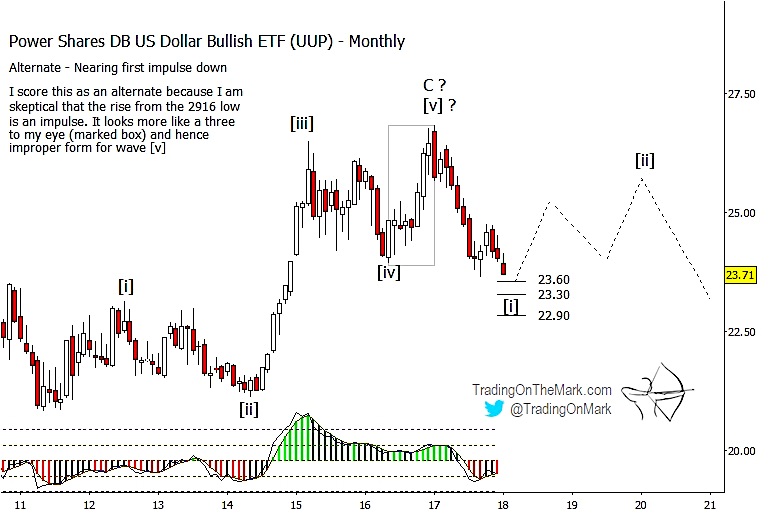
While Elliott wave analysis is useful in identifying where the turns are most probable, there’s almost always some ambiguity in a pattern when it’s still developing. Our alternate scenario for UUP treats the high on the first trading day of 2017 as a major reversal point, with price now trying to form a large downward-pointing pattern. Even this scenario offers the possibility of near-term bullish trades as price approaches important support levels.
With smaller-scale Fibonacci extension measurements as supports, we would watch for the (alternate) downward wave [i] to find support and begin a retracement from near 23.60 or 23.30. From there, price could wend through a generally upward correction until the next cycle high is due, approximately near the middle of 2019.
Our biggest concern about the alternate scenario is that the rally in to the January 2017 high should have formed a five-wave structure, but on the chart it appears to consist of only three waves.
In coming days we’ll be watching the critical levels in UUP as well as the Yen and Euro ETFs we wrote about last week.
Twitter: @TradingOnMark
No position in any of the mentioned securities at the time of publication. Any opinions expressed herein are solely those of the author, and do not in any way represent the views or opinions of any other person or entity.


