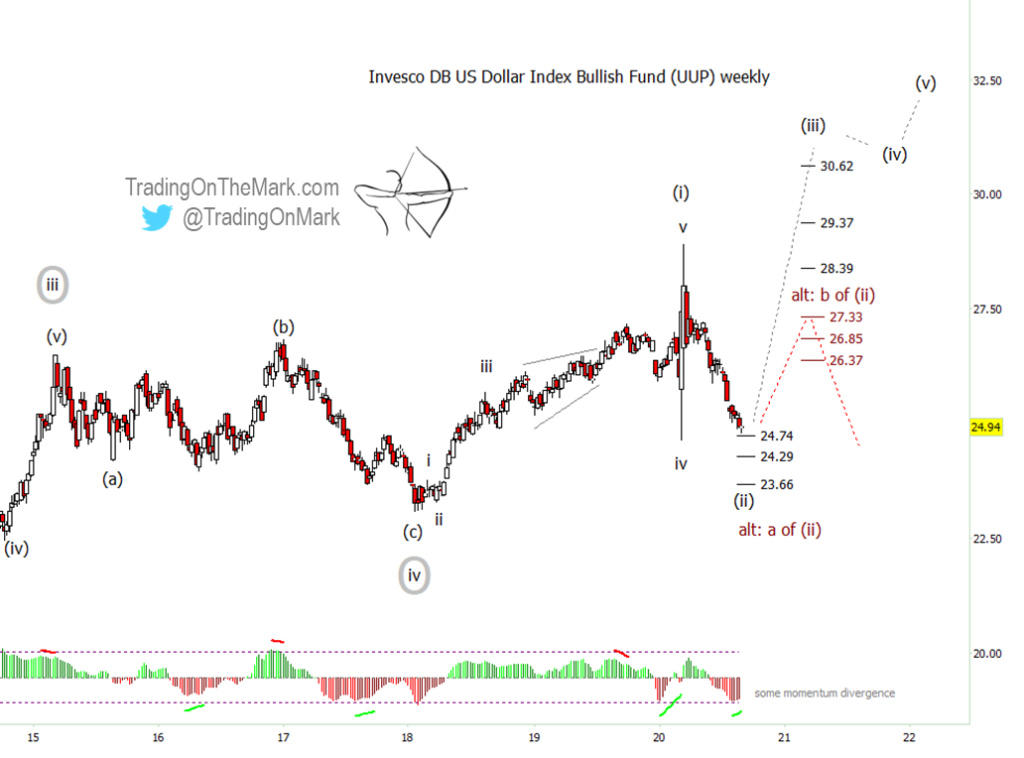
In the weeks since our July post about the Invesco DB US Dollar Index Bullish Fund NYSEARCA: UUP, price has pushed through initial Elliott wave supports and approached the area of its spike low from March.
Meanwhile, the related US Dollar Index has actually made a lower low versus March.
These developments have caused us to revise our Elliot wave count, bringing what had been our alternate scenario to the forefront.
Today’s post identifies the next support areas that traders should watch, although longer-term investors should note that we still have a bullish view of the Dollar.
The monthly chart in our July post shows how UUP has been tracing an upward impulsive pattern from its 2011 low. We believe the low in January 2018 represented wave [iv] of the five-wave sequence, and the question since then has been how to count the climb since 2018.
Treating the entirety of this year’s climb as sub-wave (i) of [v], our updated weekly chart shows some areas where the subsequent wave (ii) should test for support and possibly a bounce. The levels at 24.74, 24.39, and 23.66 are based on the internal structure of sub-wave (ii), but they are also valid if the decline is merely sub-sub-wave ‘a’ of (ii), which is now our alternate scenario.

There is some preliminary divergence between price and momentum according to the adaptive CCI indicator. We have shown previous instances where such divergence preceded a reversal.
Some very preliminary targets for a wave (iii) bounce include 27.71, 28.39, 29.37 and 30.82. If the current scenario continues to work, we would expect the first two of those levels to act merely as “stepping stones” as price reaches higher.
Visit our website for more charts, and follow Trading On The Mark for updates and special offers.
Twitter: @TradingOnMark
The authors may have a position in the mentioned securities at the time of publication. Any opinions expressed herein are solely those of the author, and do not in any way represent the views or opinions of any other person or entity.


