 By Andrew Nyquist
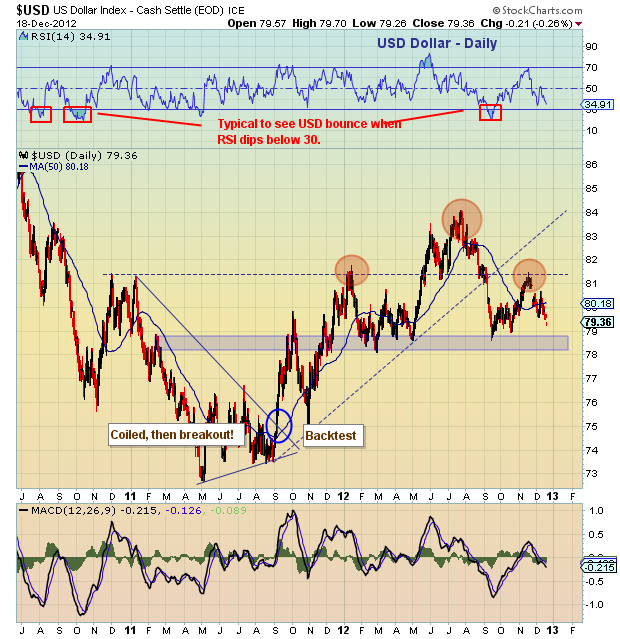
Before I really make your brains hurt and trip you out, let’s cover some quick details on the 2 year US Dollar chart. More precisely, 2 observations stick out:
1) The Dollar put in an intermediate bottom in mid-2011, before coiling and breaking out higher. That leg higher ended this past summer, giving way to a sharp selloff that saw the Dollar retrace 50 percent of its gains.
2) The Dollar is now nearing a crossroads: We have a head and shoulders formation (bearish) that is pitted against the wide-based break out higher and retracement. The key level to watch is the neckline support of the head and shoulders around 78.00-78.50 (first reported here).
If this support zone holds up and the bearish formation fails, then a big Dollar rally will ensue. If not, look out below.
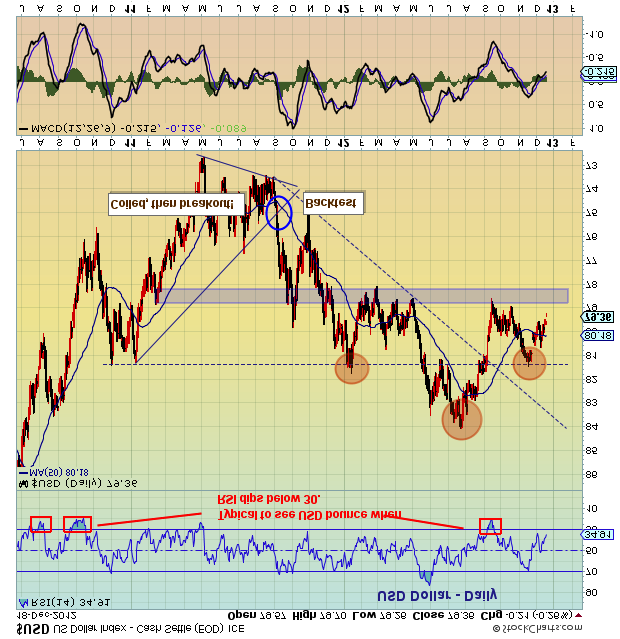
Now for some fun: a chart of the Dollar right-side up… and upside down. Happy trading.
Flip the switch: upside down
Twitter: @andrewnyquist and @seeitmarket Facebook: See It Market
No position in any of the securities mentioned at the time of publication.
Any opinions expressed herein are solely those of the author, and do not in any way represent the views or opinions of his employer or any other person or entity.


