The US Dollar debate is an important one for investors to have. And at a minimum, investors are doing the right thing by tuning in to the buck here.
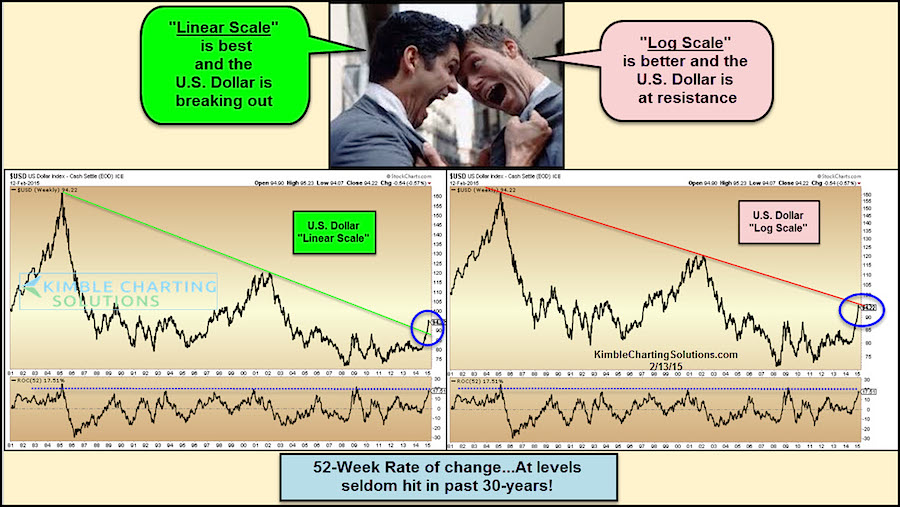
A couple week ago, I showed how the US Dollar was towering over its 200 day moving average. This surge in the US Dollar has investors debating whether we’ve see a US Dollar breakout, with some using linear scale charts and other using log scale charts. That said, the move has pushed the Dollar into overbought territory. And this usually leads to a pullback or consolidation. Perhaps we are seeing that now.
US Dollar Index – Breakout or Into Resistance?
Perhaps equally important is to the US Dollar breakout debate is the its Rate Of Change (ROC) indicator. At the bottom of the chart, you can see that I included the Rate Of Change (ROC) and it has only been this high a few times in the past 30 years! And, like many other indicators, it is near upside extremes. This can be interpreted two ways. And both are time frame dependent.
- Over the short-term this is just another reason to expect a pullback or perhaps a few months of consolidation.
- Over the intermediate-term it could be interpreted as a sign of strength. And IF (a big if) a new bull market is emerging, it would likely see some downside (after topping) followed by another thrust to new highs (breakout signal). The Dollar has been in a downtrend for the past 30 years so each ROC extreme has been another reason to sell. Will it prove different this time?
The US Dollar’s move higher has earned it a position in our discussions, but a confirmation of a breakout would turn those discussions into broader actions and change the way we manage our portfolios longer-term. Thanks for reading and have a great weekend!
Follow Chris on Twitter: @KimbleCharting
No positions in any mentioned securities at the time of publication. Any opinions expressed herein are solely those of the author, and do not in any way represent the views or opinions of any other person or entity.


