 The developing secular bull market in the United States equity markets has been driven by a flood of liquidity resulting from the global monetary experiment conducted by the major central banks of the world. The move has defied forecasts (including my own), pushed many market indicators into the trash and as a result, forced many market participants to play catch-up. To provide perspective, the NASDAQ Composite (COMPQ) is only 100 points from the best closing month level in February 2000. The NASDAQ 100 (NDX) is 300 points or less than 10% from its best closing month level in March 2000. How many saw that coming only two years ago?
It is my view that the United States equity markets are at a bend or break moment, not unlike 2011. In the case of 2011 the equity markets broke hard and swiftly. If the markets break in 2014 I project it will be similar to 2011 and not a drawn out decline that plays out for several months.
United States Equity Markets – The One Trick Pony
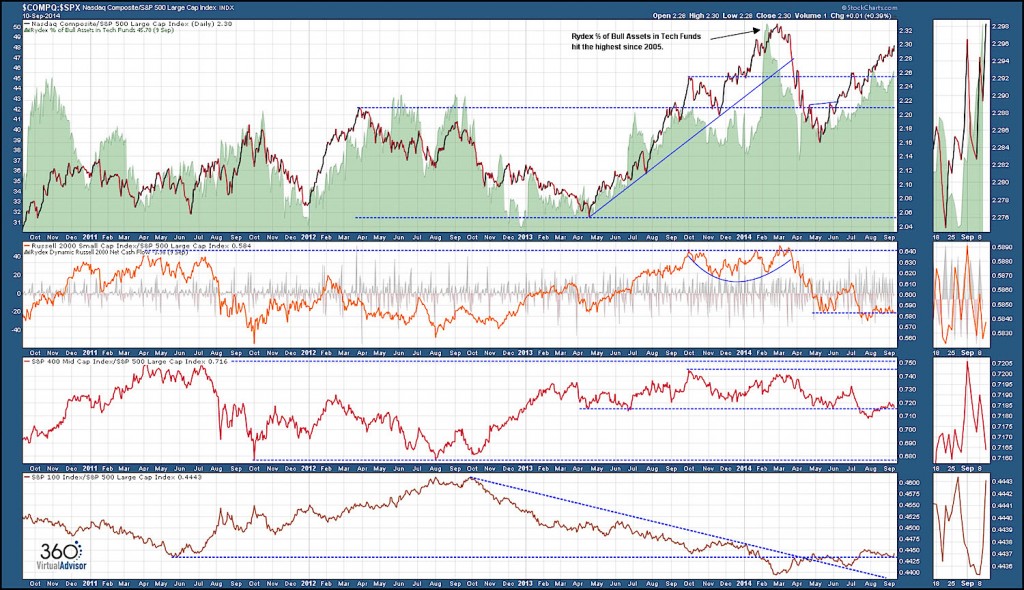
When compared to the S&P 500 (SPX), the NASDAQ Composite has been easily the strongest index since May versus the small, mid and mega-caps. Click to enlarge charts.
Source: StockCharts.com
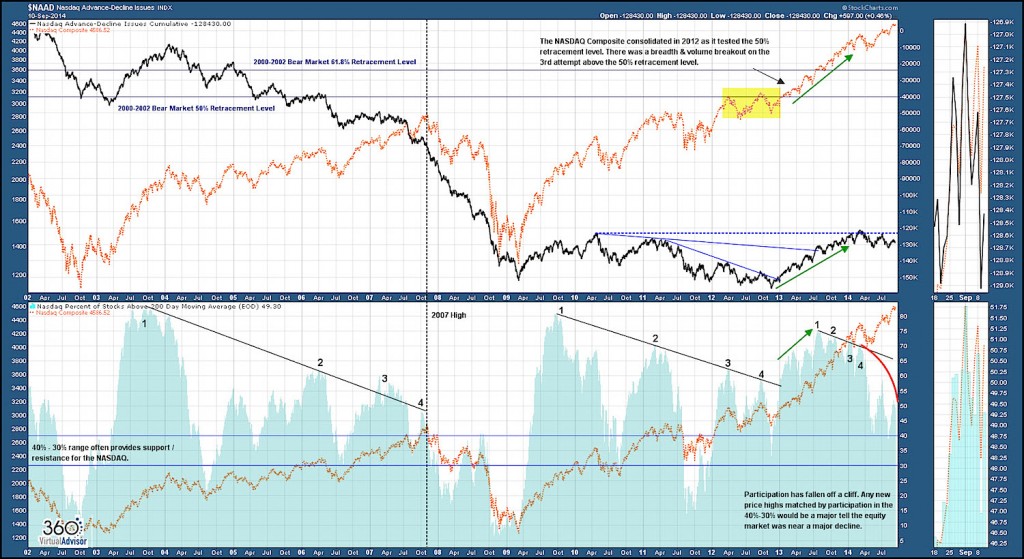
NASDAQ Composite Breadth & Volume
The NASDAQ Composite has been the leading index, but the lack of participation and volume thrust since the first quarter is a bearish undertone, particularly in term of breadths. I project that new bull market highs that are supported by less than 40% of stocks trading above the 200-day moving average over a few days will leave the index vulnerable to a sharp decline.
Source: StockCharts.com
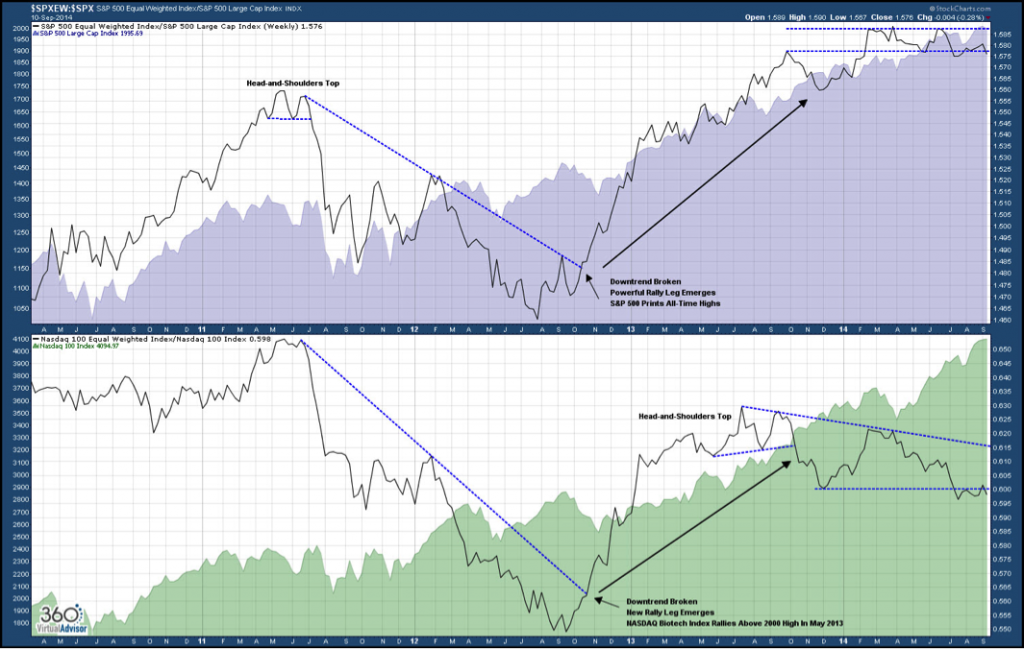
NASDAQ 100 & S&P 500 Equal Weight Indexes
The bearish picture remains the same when the equity weighted indexes are considered in the analysis.
Source: StockCharts.com
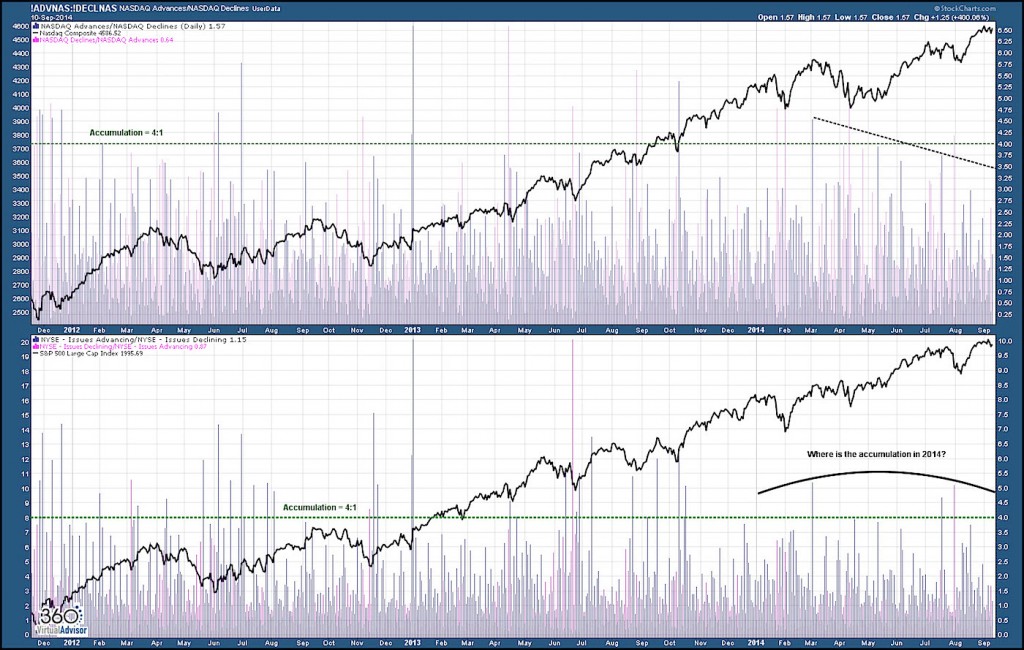
Lack of Accumulation
The lack of accumulation in 2014, particularly for the NYSE, is another bearish development in the United States equity markets.
Source: StockCharts.com
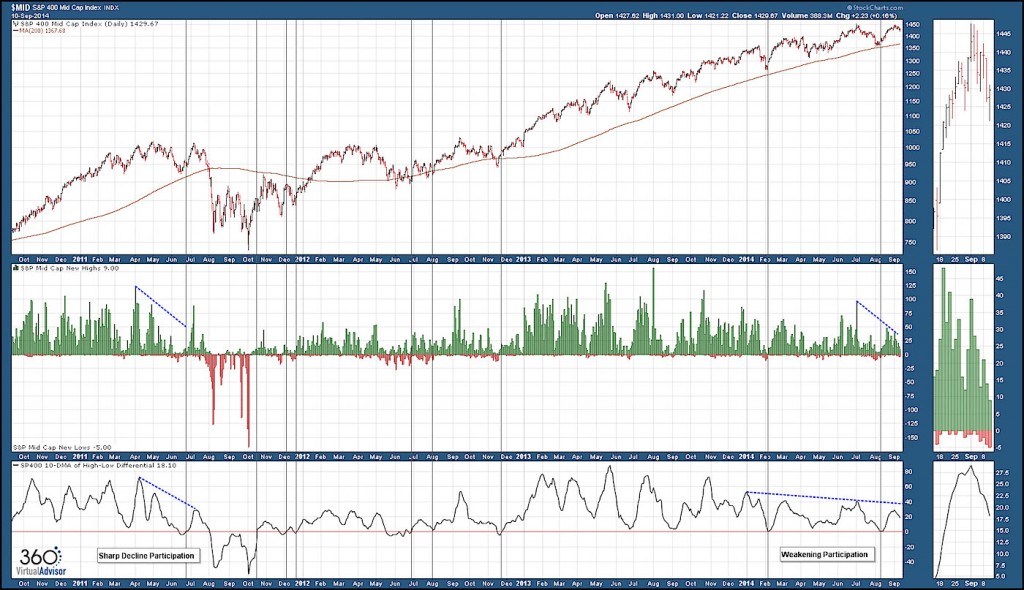
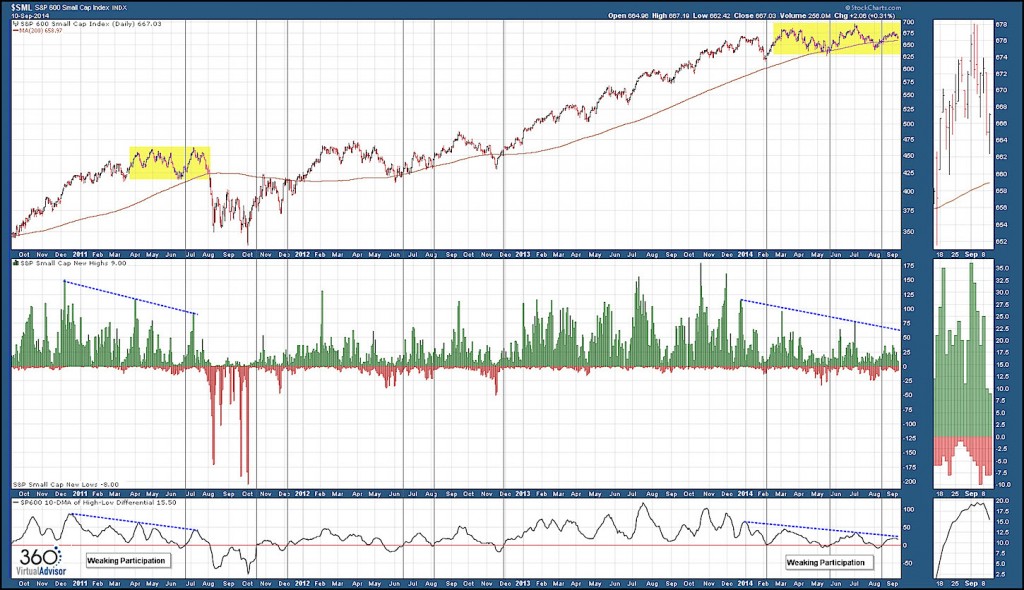
Small & Mid-Caps
The micro, small and mid-caps equities have failed to print a new bull market high for two months while the larger cap indexes have been moving higher. The negative divergence in the equity market complex is another bearish dynamic that needs to be reconciled if any short-term bullish outlook can materialize.
The lack of participation in the small and mid-caps is mirroring the market internals prior to the 2011 sell-off.
Source: StockCharts.com
Source: StockCharts.com
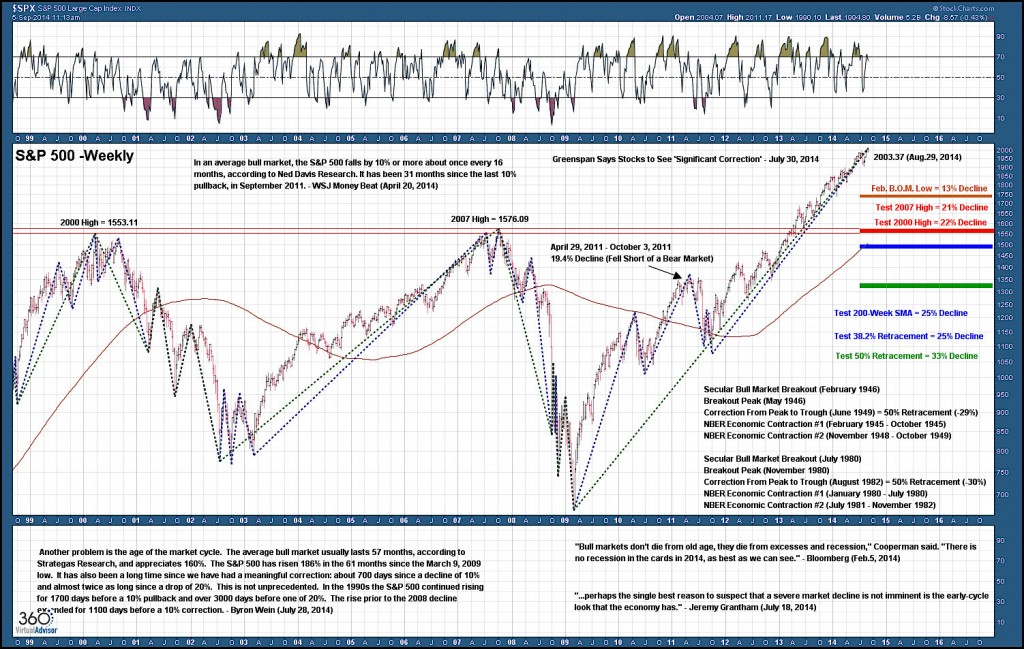
S&P 500 Correction / Bear Market Projection Levels
I think market participants need to be gaming for a major correction or bear market. The signs of exhaustion have been highlighted. The chart below presents my support level projections for the S&P 500 based on the technicals of this current secular bull market, and the historical precedents of the 1946 and 1980 secular bull market breakouts.
Source: StockCharts.com
But……
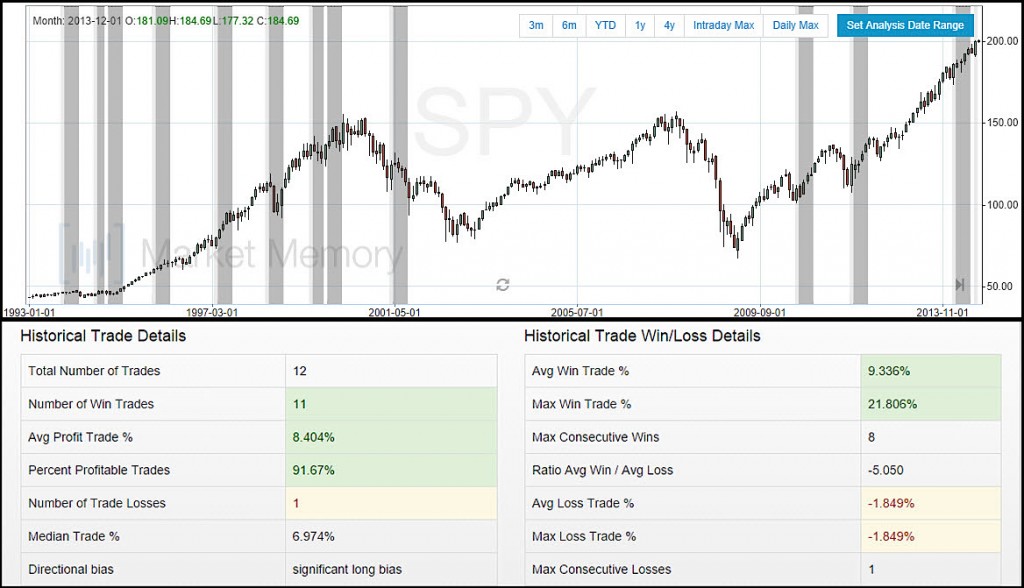
The S&P 500 exchange traded fund, SPDR S&P 500 (SPY), closed August with a Bullish Outside Month. Going back to inception SPY has closed with 12 bullish outside months. Going out four months (4 months left in 2014) the SPY shows a significant long bias. Additionally, there have three instances of a Bullish Outside Month since the 2009 low and each were followed by solid market gains.
Source: Market Memory
The current rally leg of the secular bull market for United States equities cannot be sustained with declining participation in the NASDAQ Composite, a negative divergence within the equity market complex and without renewed accumulation (demand). Market participants need to game for a major correction or bear market, but based on the historical precedent following bullish outside months any decline projects to be swift before reverting higher into year end.
Follow Sheldon on Twitter: @hertcapital
Author holds a long position in FB, BIDU, GPRO, TBT, and TWM at the time of publication. Any opinions expressed herein are solely those of the author, and do not in any way represent the views or opinions of any other person or entity.

