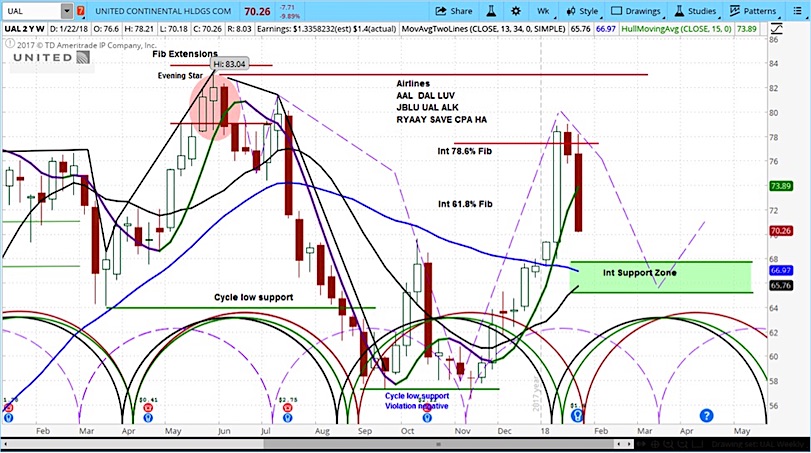
United Airlines (UAL) tumbled 10% even though it beat Wall Street earnings estimates.
After yesterday’s market close, UAL reported earnings per share of $1.40 and total revenue of $9.4 billion, compared to estimates of $1.34 and $9.43 billion respectively.
However, United management said it planned to increase capacity to grow by 4% to 6% in the coming years. This could lead to a price war, which could have a negative impact on the bottom line.
This also affected UAL’s competitors’ price action today. As represented by the JETS ETF, which was down 3.4%, having bounced from its initial lows.
In the weekly chart below, we analyze UAL’s market cycles, which suggest the stock may be headed for an intermediate support zone between $65-68. The purple dashed semicircles at the bottom of the chart represent UAL market cycles.
UAL’s gap lower on its daily chart suggests important top may be in place.
UAL Stock Chart (Weekly Bars)
Visit our site for more on our approach to using market cycles to analyze stocks.
Twitter: @askslim
Any opinions expressed herein are solely those of the author, and do not in any way represent the views or opinions of any other person or entity.


