The VIX Is About Volatility, Not Fear
The moral of the story is there is nothing wrong with having the Volatility Index in your stock market toolkit. However, the VIX needs to be used in the proper context to be more helpful to longer-term stock investors. From a 2014 Yahoo Finance article about the Volatility Index:
Today the VIX sits below 11.50 and stocks are slightly higher despite weak earnings and a widely expected, but still ugly, negative print in first quarter GDP. Rather than interpreting the market action as complacency traders are generally just accepting that the VIX is lower because the market is open for business. The thing is, the VIX never measured “fear.” It measures expected volatility. If 11.5 seems like a low print that’s only because you aren’t putting it in the context of single-digit trailing volatility. The VIX is low for a reason and that reason is that stocks simply aren’t going down in large enough gaps to justify paying much for insurance.
VIX Even Less Relevant On Longer Timeframes
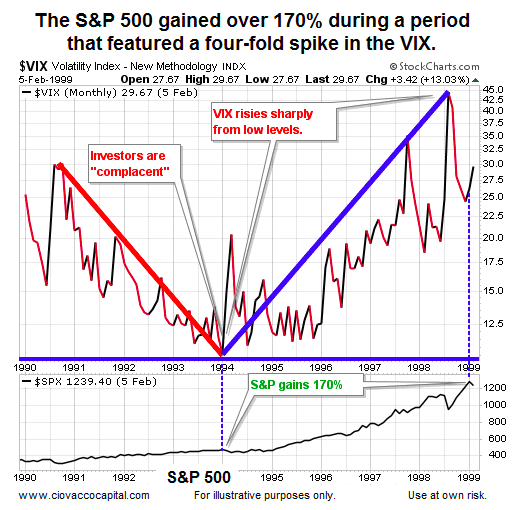
If we take the historical example above out even further in time, it emphasizes the two main points: (1) when the Volatility Index rises from low levels to higher levels, it does not necessarily mean stocks are in big trouble, especially when viewed from a longer-term perspective, and (2) low Volatility Index readings do not necessarily align with caution-oriented “complacency”. If the S&P 500 can gain over 170% during a period in which the VIX rose significantly from historically low levels, it tells us to be careful about how we interpret and use the VIX.
September Rate Hike Odds Drop
The market’s pricing mechanism has an almost infinite number of moving parts. One of the important parts is Fed policy. Thursday’s weaker than expected read on the economy makes it easier for the Fed to stay in the “do nothing” camp in September. From Reuters:
U.S. retail sales fell more than expected in August, pointing to cooling domestic demand that further diminishes expectations of a Federal Reserve interest rate increase next week…Financial markets are pricing in only a 12 percent probability of a rate hike next week, down from 15 percent before the data, according to the CME.
Investment Implications – No Need To Anticipate
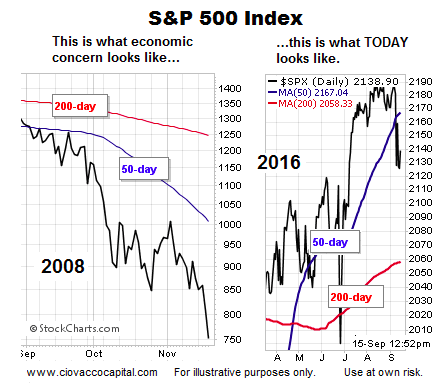
Have stocks corrected after the Volatility Index hit low levels? Yes, and we can find numerous historical cases where a rising VIX occurred during a weak period for equities. Regardless of what the VIX does, we know it is highly unlikely the stock market will enter a multiple-month correction or a multiple-year bear market without seeing some evidence of deterioration on the chart of the S&P 500. How vulnerable does the broader stock market look right now? The charts below allow us to compare 2016 to a higher risk period in 2007.
This video clip explains why the charts above are helpful. Is using moving averages a perfect way to manage portfolio risk? No, but used in conjunction with other economic and technical inputs, it can help us stayed aligned with the market’s risk-reward profile.
The VIX Can Be Helpful
Before you begin composing emails or tweets about the usefulness of the Volatility Index, note that our market model uses the VIX. This means that we agree it can be helpful. The key point is time frames. Shorter-term traders may have found countless relevant ways to effectively use the VIX. We are investors, meaning it is important for us to understand what the Volatility Index can and cannot do on a longer-term time horizon relative to the stock market.
Thanks for reading.
Twitter: @CiovaccoCapital
The author or his clients may hold positions in mentioned securities at the time of publication. Any opinions expressed herein are solely those of the author, and do not in any way represent the views or opinions of any other person or entity.


