Under Armour (UAA) reported quarterly earnings pre-market on Tuesday and the reaction wasn’t pretty, seeing its stock price fall sharply.
The company reported adjusted EPS of $0.10, which met consensus estimates of $0.10.
Revenue came in at $1.44B, which missed estimates of $1.47B.
Under Armour forecasted sales to be down in the low single digit percentages for fiscal 2020.
Under Armour’s CEO, Patrik Frisk, told analysts that the heavy promotional activity from retailers such as Kohl’s has negatively impacted the company’s pricing power.
Given this background, let’s see what the Under Armour stock chart tell us.
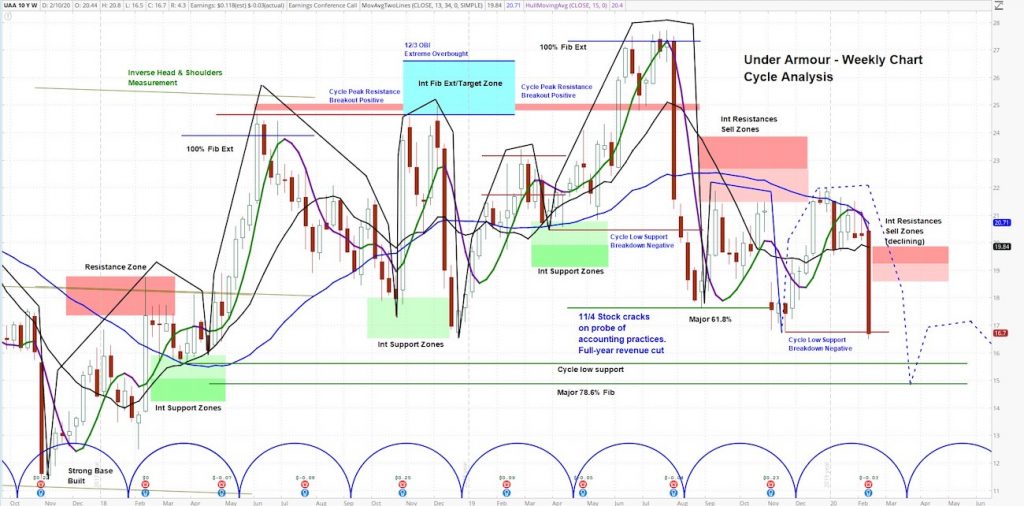
Under Armour (UAA) Weekly Chart Grid – annotations by askSlim.com

At askSlim.com we use technical analysis to evaluate price charts of stocks, futures, and ETF’s. We use a combination of cycle, trend and momentum chart studies, on multiple timeframes, to present a “sum of the evidence” directional outlook in time and price.

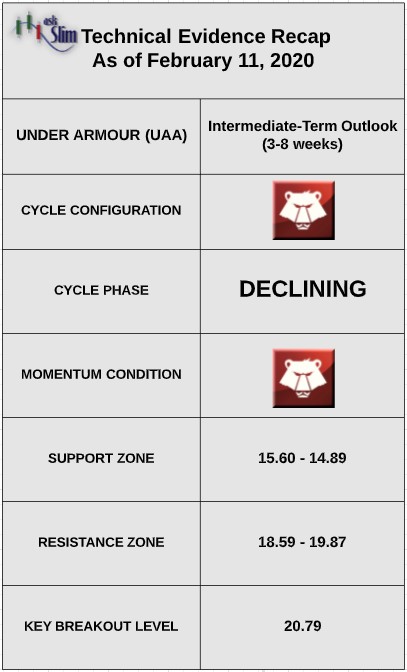
$UAA askSlim Technical Briefing
The weekly cycle analysis suggests that the stock is in a declining phase. The next intermediate-term low is due in the middle-to-end of March. Weekly momentum is negative.
On the upside, there are declining intermediate-term resistance zones from 18.59 – 19.87. On the downside, there is prior cycle low support at 15.60 followed by a major Fibonacci support at 14.89. For the bulls to regain control of the intermediate-term, we would likely need to see a weekly close above 20.79.
$UAA askSlim Sum of the Evidence
UAA is in a negative cycle pattern with negative momentum. Given these conditions, we would expect short-term rallies to fail until the next intermediate-term low forms. There is a likelihood the stock tests 14.89 by the end of March.
Interested in askSlim?
Get professional grade technical analysis, trader education and trade planning tools at askSlim.com. Write to matt@askslim.com and mention See It Market in your email for special askSlim membership trial offers!


