Under Armour NYSE: UAA reported earnings on Monday. Both earnings per share (EPS) and revenue missed expectations.
The company reported an adjusted loss of 34 cents on revenue of $930.2M.
Consensus estimates called for an adjusted loss of 19 cents on $949M in revenue.
Under Armour announced plans to cut around $325M in operating costs in 2020.
Given this background, let’s take a look at the weekly chart.
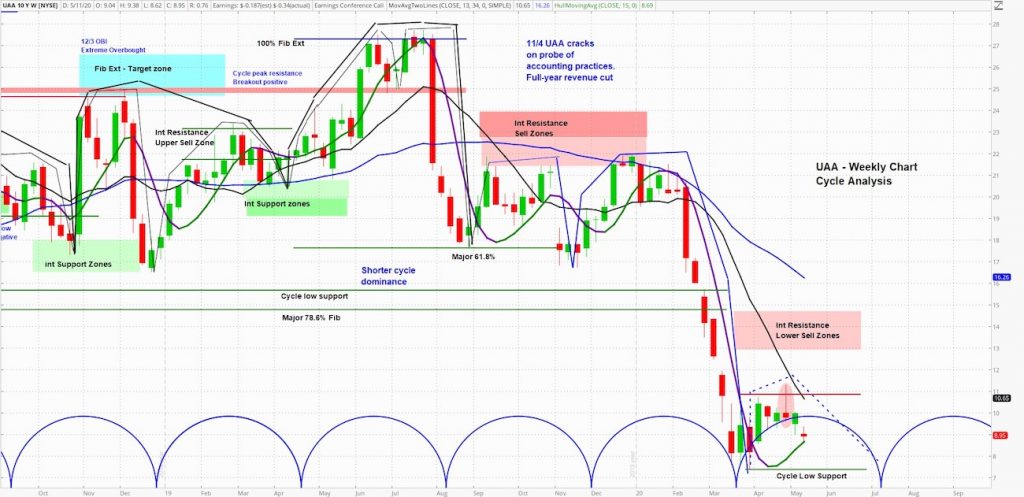
Note the current price action and cycle projection.
Under Armour (UAA) Chart

At askSlim we use technical analysis to evaluate price charts of stocks, futures, and ETF’s. We use a combination of cycle, trend and momentum chart studies, on multiple timeframes, to present a “sum of the evidence” directional outlook in time and price.
askSlim Technical Briefing:
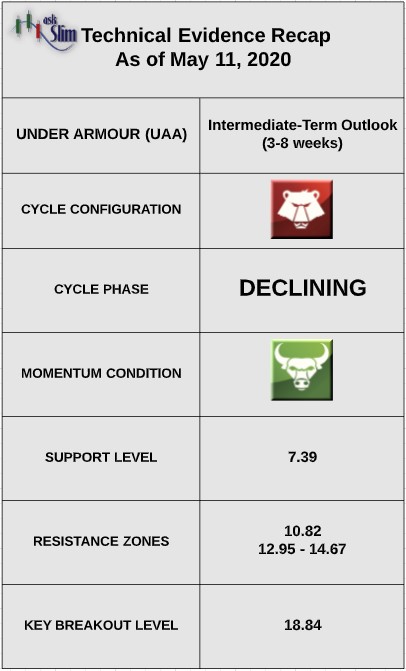
The weekly cycle analysis suggests that UAA is in a declining phase in a very negative intermediate-term pattern. The next projected intermediate-term low is due in July. Weekly momentum is currently positive and poised to roll over.

On the upside, there is an intermediate resistance at 10.82 followed by another zone of resistance from 12.95 – 14.67. On the downside, the only visible support is the recent cycle low at 7.39. For the bulls to regain control of the intermediate-term, we would need to see a substantial rally back over 18.84 to repair some of the damage done on the downside.
askSlim Sum of the Evidence:
UAA is in a very negative intermediate-term pattern. There is a likelihood the stock trades below the prior cycle low at 7.39 and down below 7 by July.
Interested in askSlim?
Get professional grade technical analysis, trader education and trade planning tools at askSlim.com. Write to matt@askslim.com and mention See It Market in your email for special askSlim membership trial offers!
Twitter: @askslim
Any opinions expressed herein are solely those of the author, and do not in any way represent the views or opinions of any other person or entity.


