Trading the next move in U.S. Treasuries
Last year, U.S. treasury bonds and the related ETF (TLT) began falling away from what we had long been treating as the completion of an ending diagonal pattern within the context of elliott wave. The decline was fairly abrupt until price approached the lower edge of the diagonal, where we saw the beginning of a retracement.
Our last piece about treasuries and the iShares 20+ Year Treasury Bond ETF (NASDAQ:TLT), posted in January, indicated we were expecting price to bounce from a support zone near the edge of the pattern. In fact the retracement began from slightly higher than we expected.
Hopefully traders who had acted on our earlier bearish forecast for bonds and TLT noted the signals that it was time to close the short trade. Downward momentum had begun decreasing, and a consolidation appeared to be forming at the turn of the year. Even though price did not reach quite as low as we expected on that move, there were downward thrusts even after momentum had started decreasing. Those downward thrusts were the exit opportunities.
The choppy rise from the turn of the year appears to have been corrective, in this case meaning that it should be treated as a retracement. Even though there is more than one way to count the downward move from 2016, the most probable scenarios say the next trade should be downward.
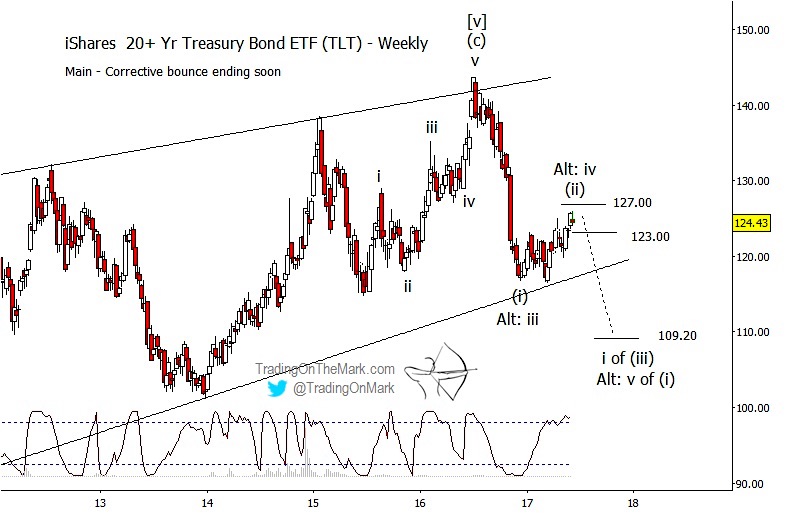
iShares 20+ Year Treasury Bond ETF (TLT) – Elliott Wave Chart
Treating the entirety of the strong decline from 2016 as wave (i) of a developing downward elliott wave pattern, our main scenario views the upward retracement as corrective wave (ii). Consistent with that count, we would watch for resistance between the current area and the next Fibonacci retracement level of 127.00. If that view is correct, then a very powerful downward wave (iii) could start from near the present area.
Traders should be mindful of two additional scenarios. First, the upward retracement might not be the wave (ii) counterpart to the big downward wave (i). Instead, it might represent an internal correction that needed to take place before downward wave (i) is really finished. In that case, we would view the correction as sub-wave ‘iv’ inside wave (i). The move out of the correction would still be downward, but it could find support in an area slightly lower than the lows of early 2017. The big, dramatic wave (iii) decline would have to wait for a later time.
A second alternative to keep in mind is that the rally from late 2016 might represent merely the first part of a wave (ii) correction. In that case, we would probably see a choppy downward/sideways move play out for several months, with price possibly even re-testing the lows from December and March. We would then see another rally to test higher retracement levels not yet shown on the weekly chart here.
The dominant cycle suggested by the Lomb periodogram and other cycle tools suggests that the present area represents a local high, with the next downward or sideways phase expected to persist at least until autumn 2017.
There is not a single best trade strategy for this set of Elliott wave scenarios. The right strategy depends on one’s own trading style and time frame. However, knowledge of the main and alternative counts helps a trader know where to place protective stops and where to consider profit-taking.
In this case, we don’t expect TLT to rise much beyond the nearby resistance… but it could. That tells you approximately where to place stops if you are in a short trade. Meanwhile, we expect the next downward move to push substantially beneath prior lows… but it does not have to. That tells you where to pay attention to other types of signals on your charts that would mark a decrease in downward momentum instead of an increase.
The Trading On The Mark chatroom is a great venue for talking through trading strategies in situations like this. Subscribers have access to that along with numerous chart updates every day. Take a look at the ways we can help you improve your trading!
Twitter: @TradingOnMark
No position in any of the mentioned securities at the time of publication. Any opinions expressed herein are solely those of the author, and do not in any way represent the views or opinions of any other person or entity.


