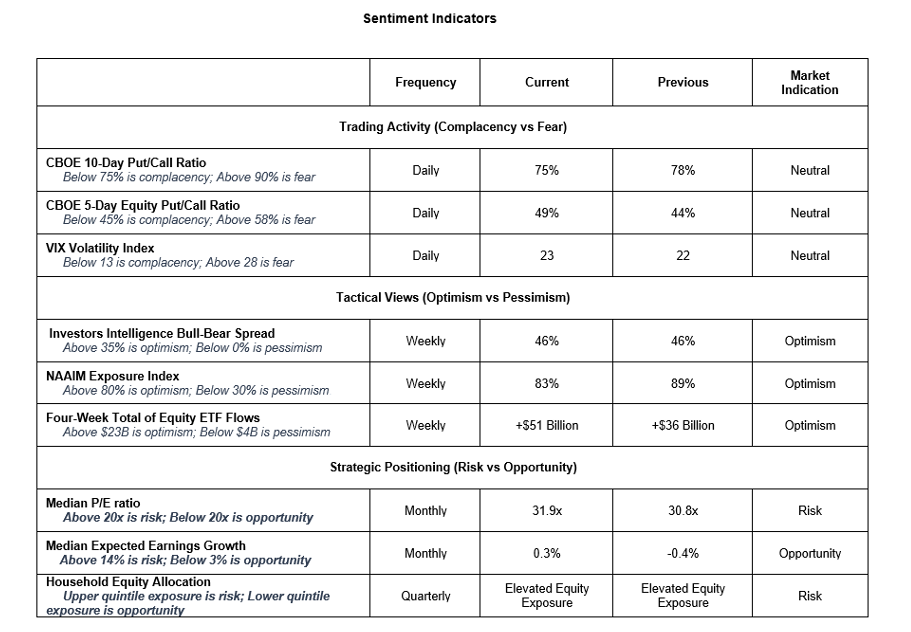
Stocks have climbed a wall of worry for much of the past months so it’s not surprising that investors are getting complacent and have become overly bullish.
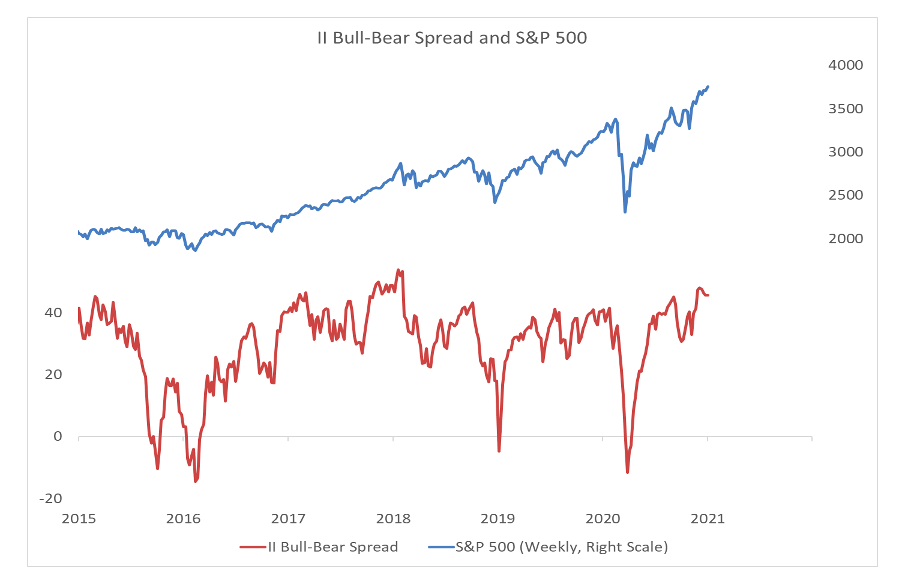
Near-term complacency has eased somewhat but weekly surveys are still heavily tilted toward optimism.
Most investors are positioned for late-2020 momentum to carry stocks higher into 2021.
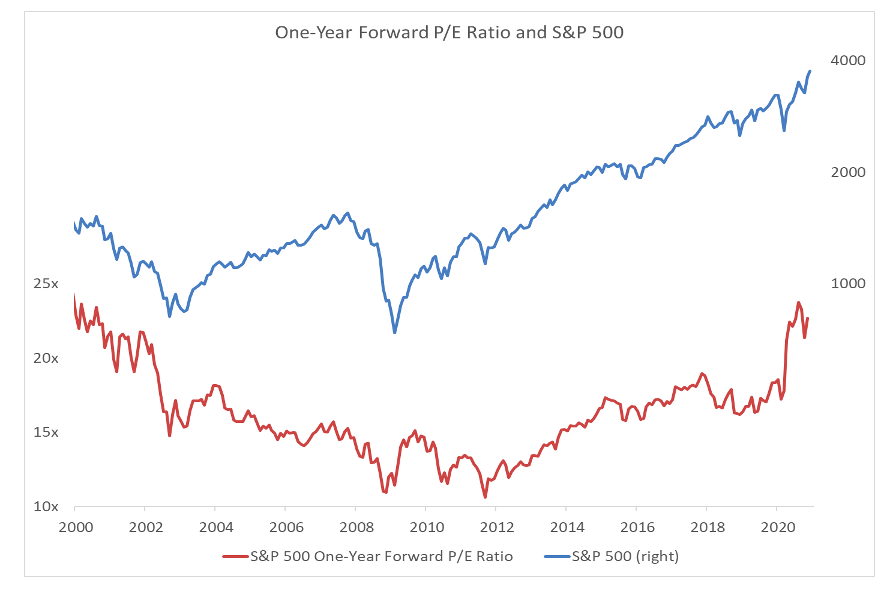
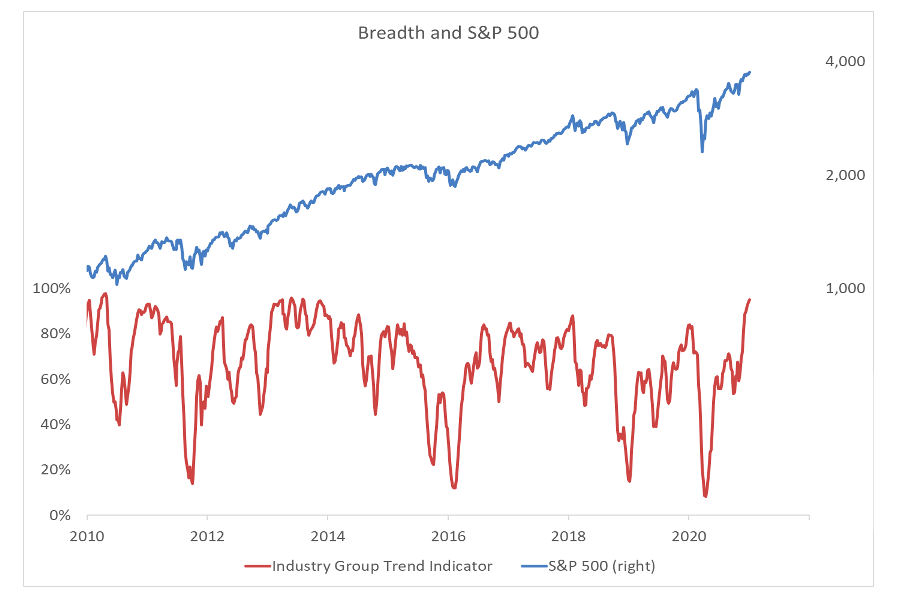
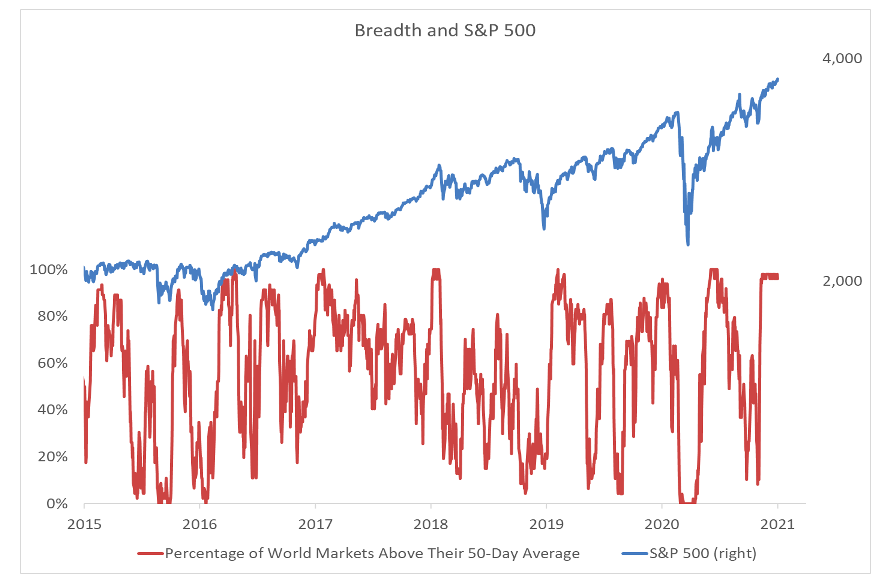
With stock market breadth robust (as seen in both industry group trends and the percentage of world markets trading above their 50-day averages), near-term sentiment risks are more about volatility that sustained weakness. Longer-term, earnings growth expectations (on a median basis) are not unduly high, but overall valuations on both a trailing and forward basis are not consistent sustained stock market strength.
Twitter: @WillieDelwiche
Any opinions expressed herein are solely those of the author, and do not in any way represent the views or opinions of any other person or entity.

: Creating Bullish Divergence?")


: Creating Bullish Divergence?")

