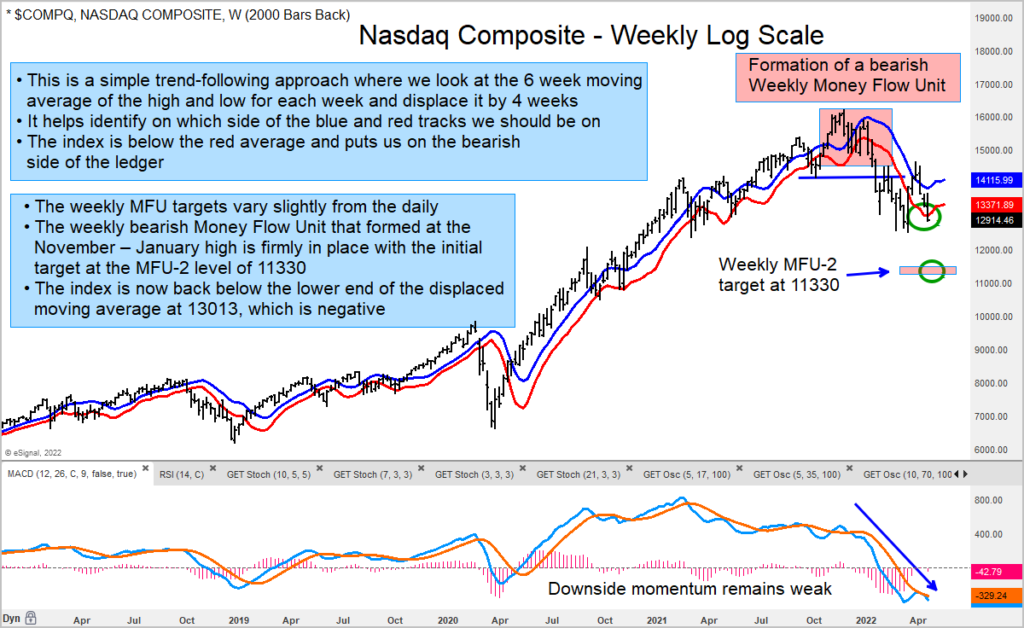
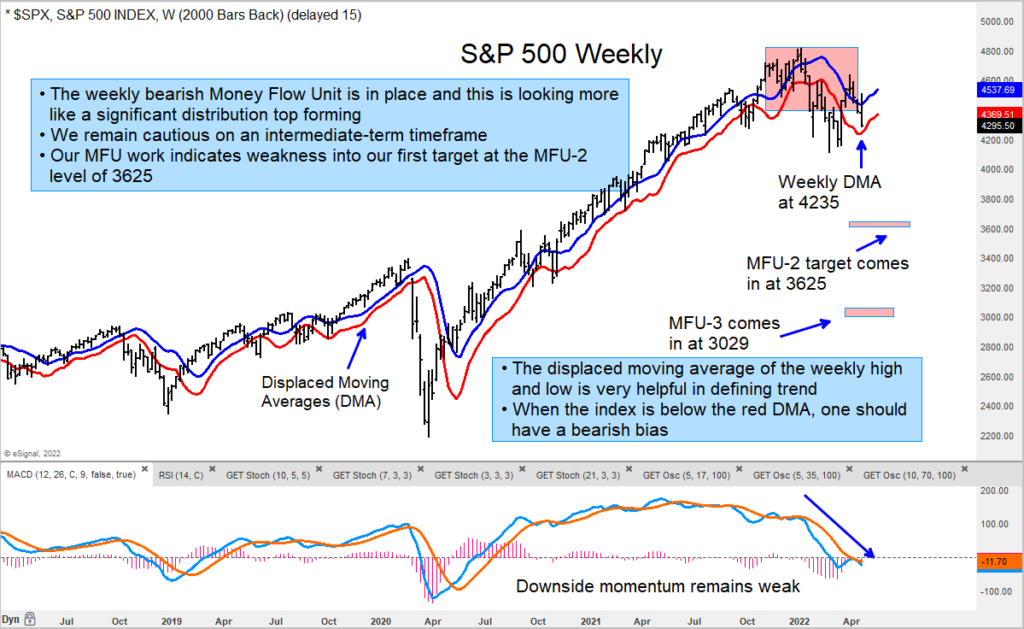
It’s been a volatile past few weeks the U.S. stock market with several indices in decline once again.
The Nasdaq and Russell 2000 are very weak and the inability for the S&P 500 Index to close above the trigger level of 4472 is very telling of a market that is being met with intense selling pressure.
Our work is focused on the big picture monthly and weekly timeframes, and what we are seeing with this week’s action is further evidence that the bearish money flow units we have identified at the December – January highs are valid.
From here out we are going to have to deal with the wiggles in short-term rallies which we will use to raise cash until / unless something changes on our indicators.
In summary, we remain very cautious on an intermediate-term timeframe.
Nasdaq Composite “weekly” Chart

S&P 500 Index “weekly” Chart

Twitter: @GuyCerundolo
The author or his firm have a position in mentioned securities at the time of publication. Any opinions expressed herein are solely those of the author, and do not in any way represent the views or opinions of any other person or entity.


