Looking back over the past month or so, we’ve seen the Federal Reserve raise interest rates for the second time in a year, and Congress fail to repeal or replace Obamacare.
The stock market could have interpreted both as negatives. However, instead of seeing rising interest rates as a threat to equity prices, it saw them as proof from the Federal Reserve that the economic recovery is firm. Confidence is a pillar of markets.
In addition, the market is excited by Washington’s next project, tax cuts, and apparently believes that the Republicans will have more success on this front than they did with healthcare. As I mentioned in last month’s newsletter, the Fed this month will start destroying the cash that it printed during the financial crisis. Also, several Republicans have already indicated that they are out-of-step with automatic tax cuts. Although I am long-term bullish, I wonder if the stock market might be overly optimistic at the present time, given a rising rate environment and continued morass in Washington.
Stocks & Bonds
The U.S. stock market continues its upward trajectory, with the S&P 500 (NYSEARCA:SPY) at all-time highs. The market has interpreted the Federal Reserve’s actions as proof that the recovery is under way, and still-low interest rates make bonds less attractive on a relative basis. Washington has turned its attention from Obamacare repeal to tax reform, further buoying investors’ hopes. Here are the numbers from September:
Commodities & Currencies
Oil prices have recovered some while the price of Gold (NYSEARCA:GLD) has fallen back some on a Federal Reserve that continues to raise rates and, more importantly, continues to project more rate increases in the next 12 months. Gold lost almost 3% last month and is still toiling a bit (though still up on the year).
A rising interest rate environment is unfriendly for gold, but is positive for the U.S. dollar, which is down for the year but appears to be firming up.
Economy
The ISM Manufacturing PMI in September came in at a roaring 60.8%, stronger even than August and showing the 100th straight month of economic expansion. The non-manufacturing, or services, index came in at 59.8%, also showing continued strong expansion. The Commerce Department released its third estimate of second quarter growth, updating their estimate yet again from 3.0% annualized growth to 3.1% growth.
The National Association of Realtors reports that existing-home sales in August 2017 were 1.7% lower than in August 2016. However, the median price rose 5.6% to $253,500 from a year earlier. Median home prices have now been rising for the past 66 months. Distressed sales (foreclosures and short-sales) were just 4% of total sales in August, down from 5% a year ago.
Market Commentary
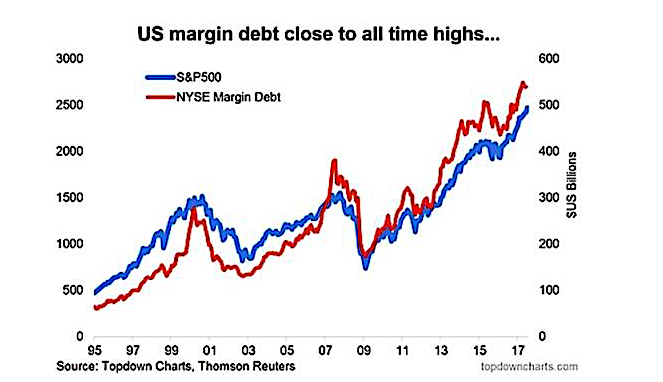
The NYSE reported that in August, margin debt outstanding stood at just over $550 billion. This is 3x as high as it was in 2009, just after the crisis. Margin debt is money borrowed by speculators to buy stocks – usually hedge funds but sometimes individuals. If you think that it’s crazy that over half-a-trillion dollars has been borrowed and then ‘invested’ in stocks, you’re not alone. History shows that abnormally high levels of speculation in stocks are not necessarily healthy for future prices – these gamblers have very little patience or tolerance for price swings, and if half-a-trillion dollars needs to exit the market quickly, stocks will have a problem. This graph, showing margin debt next to the performance of the S&P 500, makes the point just as well – spikes in the red line, margin debt, can sometimes precede large declines in the blue line, the stock market:
I remain wary of the recent stock market gains, and committed to a diversified portfolio for both the short- and long-term.
Data Sources:
www.standardandpoors.com – S&P 500 information
www.msci.com – MSCI EAFE information
www.barcap.com – Barclays Aggregate Bond information
www.bloomberg.com – U.S. Dollar & commodities performance
www.realtor.org – Housing market data
www.bea.gov – GDP numbers
www.bls.gov – CPI and unemployment numbers
www.commerce.gov – Consumer spending data
www.napm.org – PMI numbers
www.bigcharts.com – NYMEX crude prices, gold and other commodities
https://www.nyxdata.com/nysedata/asp/factbook/viewer_edition.asp?mode=tables&key=50&category=8 – NYSE margin debt numbers
https://www.seeitmarket.com/nyse-margin-debt-peaks-now-rolling-over-investing-17149/ – margin debt graph
Any opinions expressed herein are solely those of the author, and do not in any way represent the views or opinions of any other person or entity.


