There was minimal net change by Thursday’s close as equity markets trudge along into February, a notoriously difficult month seasonally for Equities in post-election years.
On Thursday, the S&P 500 (INDEXSP:.INX) yet again attempted to move lower. But by end of day, the major index had regained all its losses to close at a fractional gain.
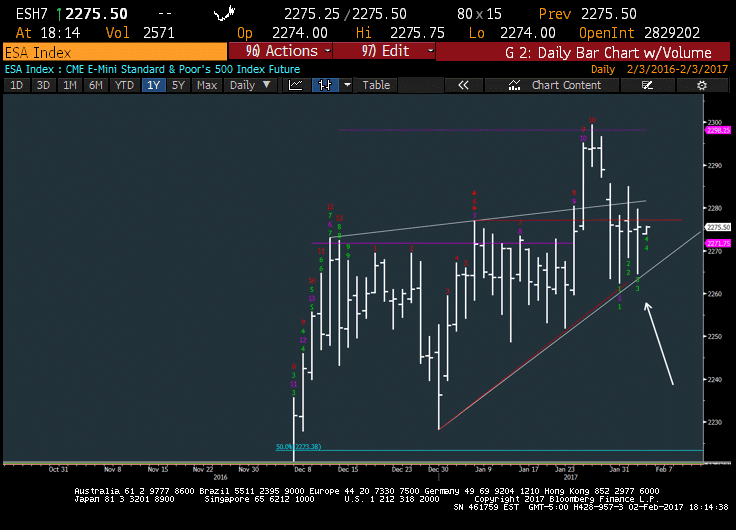
In fact, the last four trading sessions have seen the S&P 500 futures contract close up 11, 6, 12, and 13 points respectively from intra-day lows. Those dips tested support from early January (and held), while sporting meaningful rebounds intraday.
There’s no change in my outlook based on yesterday’s resilience. If anything, it adds conviction that this 2262-4 area is quite important for S&P 500 futures. As in previous days, it’s right to be long vs this level (with a stop on a closing basis) – thinking that prices push higher above this level.
Developments concerning three key technical moves:
First, the US Dollar fell to its lowest levels since last November when eyeing the US Dollar Index (CURRENCY:USD). The Dollar/Yen currency pair fell to Tuesday’s lows, but is set to finish at the lowest weekly closing level since November and looks vulnerable. Precious metals, meanwhile, rocketed higher, as Gold initially broke out above prior 1223 highs before settling. Gold is still set to close at the highest weekly close with one day remaining since mid-November as well. Additional gains look likely for both Gold and Yen (USDJPY goes lower) in the short run as the Dollar’s stabilization still looks a bit premature.
Second, the Defensive sectors have begun to lift, with Utilities and Consumer Staples attempting bounces over the last couple days. Real estate is also lifting. Some of this has to do with defensive positioning while the other strength looks purely interest rate related. For now, this rally in these groups should prove short-lived for the time being. And technically this looks good to sell into as the global bond selloff doesn’t look anywhere near complete in the short run.
Third, the Financials Sector (NYSEARCA:XLF) has not really shown much weakness, which is important to note given that Treasury yield rallies look to have stalled a bit in the near-term. The XLF has been literally unchanged since early December, but on weekly charts, continues to resemble a “flag” formation, which could lift higher up to $25 or so before any real drawdown. So the 1% declines seen Thursday in KRE, KBE, and XLF really haven’t done much, if any real damage. For now, the combination of a resilient tape, decent leadership and good breadth overall (Advance/decline near highs) should outweigh the near-term seasonality concerns coupled with a bit of stalling in short-term breadth.
S&P 500 Futures Chart – Daily
The daily chart shows how many consecutive days S&P 500 has now rallied substantially off its lows. While momentum is starting to wane given the initial failed rally into late January, from a price perspective, this pattern remains constructive and should allow prices to move higher to test former highs before any meaningful pullback gets underway. Pullbacks under 2262 in Futures (2267-SPX cash) would change this thinking and allow for a minor drawdown to get underway for February.
Thanks for reading.
Note that you can catch more trading ideas and market insights over at Newton Advisor. Thanks for reading.
Twitter: @MarkNewtonCMT
Any opinions expressed herein are solely those of the author, and do not in any way represent the views or opinions of any other person or entity.


