The U.S. equity market is turning bearish this week, as investors appear to be locking in profits with economic uncertainty rising and the elections around the corner.
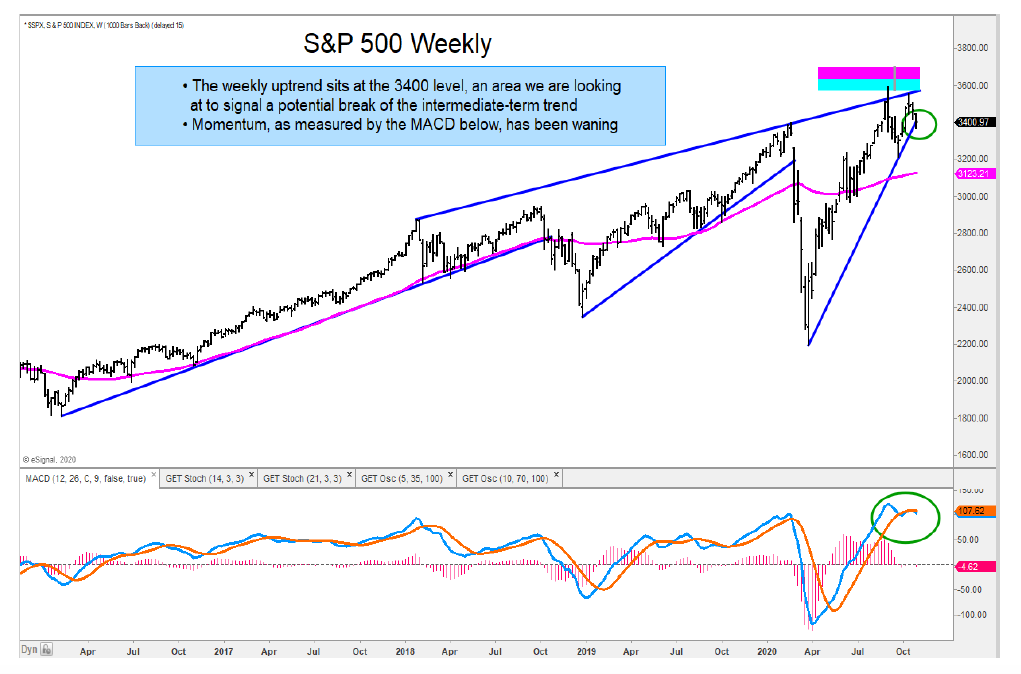
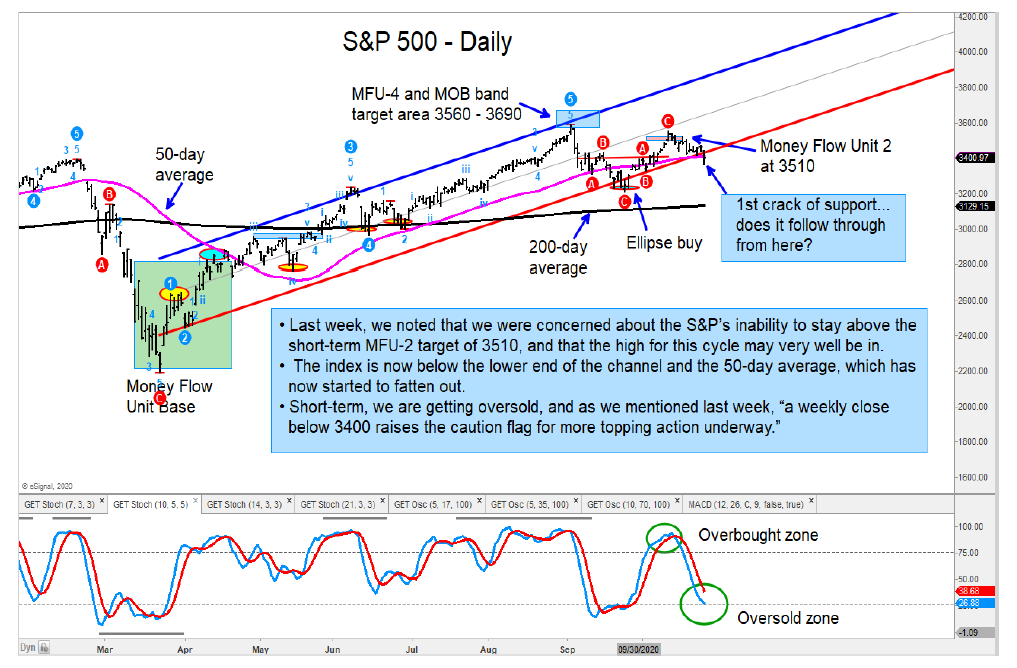
The S&P 500 and Nasdaq Composite stock market indices are trading heavy into up-trend price support lines on the “weekly” charts. However, the S&P 500 is breaking below its support line on the “daily” chart.
This appears to be ominous and may be signaling a broader break lower for the major stock market indices.
Below are charts of the S&P 500 Index “daily” and “weekly”, along with the Nasdaq’s “daily” chart.


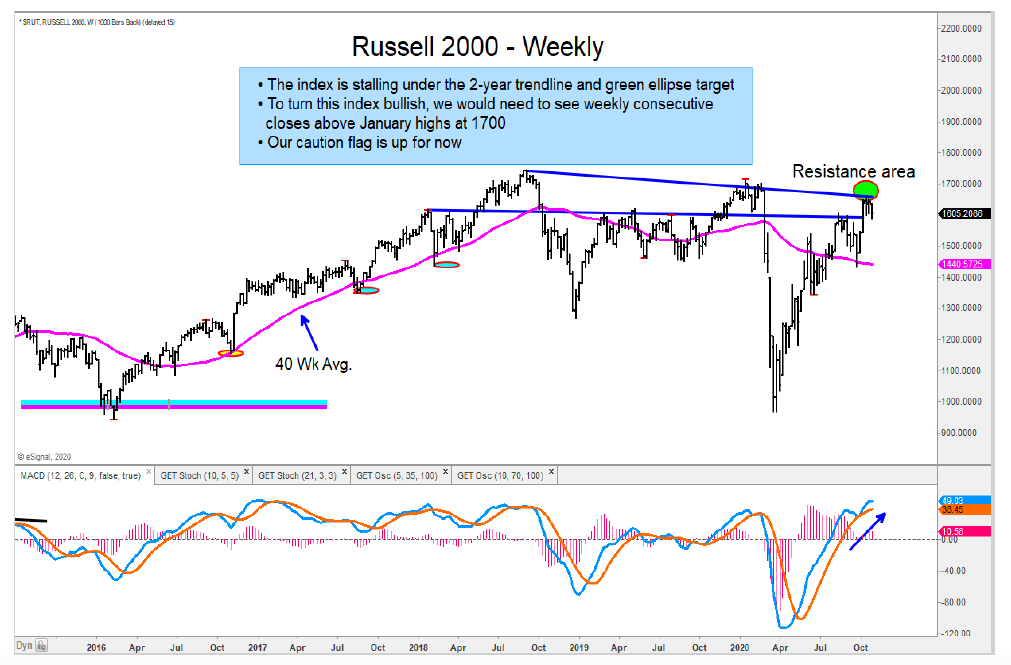
The Russell 2000 continues to struggle below their target areas we have identified in prior reports.

The Dow Jones Utilities Index has been trading into its MOB target band for the last three weeks. A break above 895 will be positive for bullish investors.
I remain negative the 20+ year treasury bond ETF (TLT) and expect it to find resistance in the 161—162 area. This is aother zone to short, in my opinion.
Both the Semiconductors ETF (SMH) and Technology Sector ETF (XLK) have slid lower. And in the case of the XLK, it has broken its channel support. The SMH is testing that support now.
The author has a position in the mentioned securities at the time of publication. Any opinions expressed herein are solely those of the author, and do not in any way represent the views or opinions of any other person or entity.


