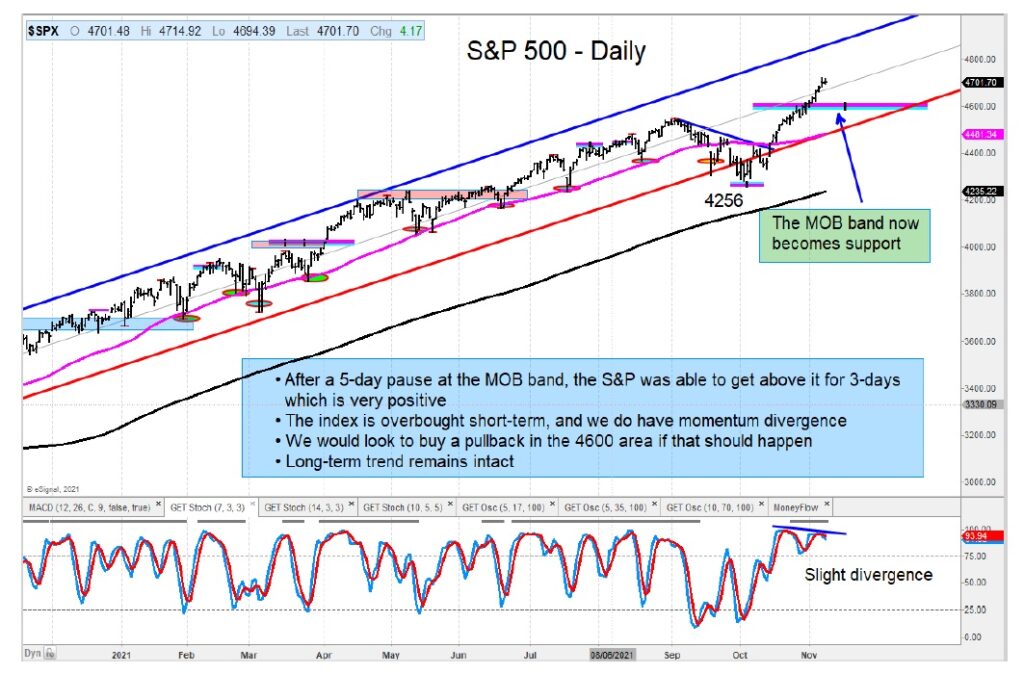
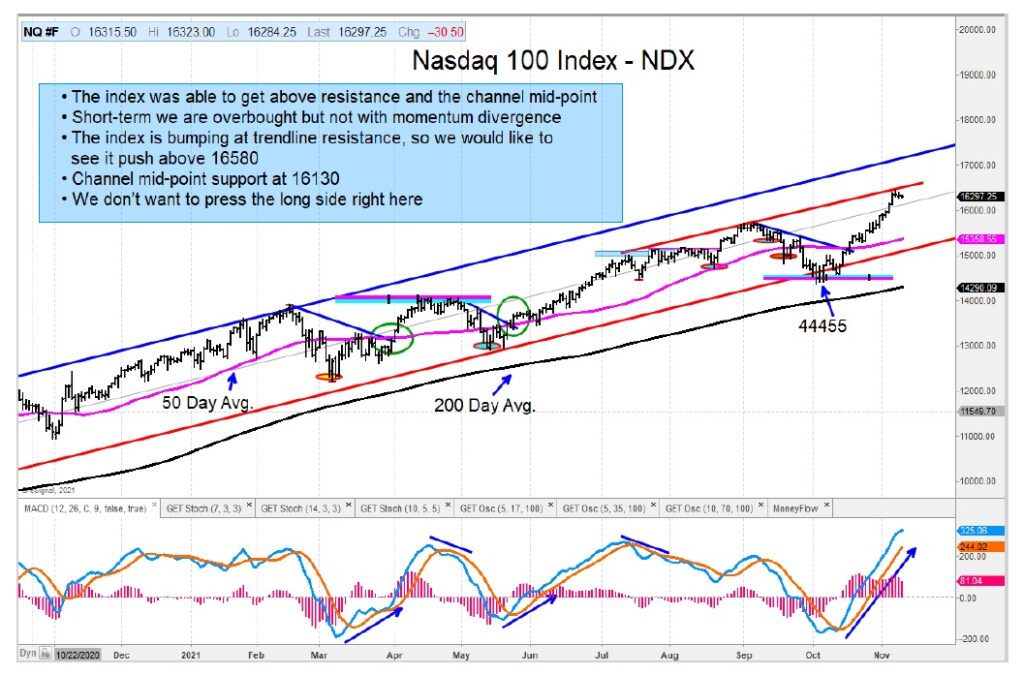
The strength of the U.S. Equity market has been on full display for the past 4-5 weeks. It is now recording some overbought signals with certain areas stronger than others.
A few weeks back, the S&P 500 Index made a 5-day pause at a MOB target price band… it broke out above that resistance and hasn’t looked back. That breakout extended the advance off the October low.
That said, the S&P 500 is extended here.

The Nasdaq 100 Index is very extended on a short-term basis and bumping up against trend-line resistance. We have momentum divergence on a weekly timeframe.

We thought the Russell 2000 Index would have more of a pause as it came into a MOB target band, but it only lasted two days. With a strong momentum move, the index pushed into new high territory and made a clear break out of a large consolidation base pattern. This has bullish long-term implications.
Like the Russell 2000 Index, the MidCap Index (MDY) has also cleared a multi-month consolidation with strong momentum.
Elsewhere in the financial markets…
The U.S. Dollar Index (DXY) is now testing support off the May low. This is bullish.
No change in my view of WTI Crude Oil. We are looking for the next leg up to carry prices into the $88.25 area. Natural Gas on page 13 has pulled back to a buy zone. Volatility has picked up in recent weeks, so we would start a small long position here.
Gold hasn’t done much in a while and price is coming into the apex of a tight trading range. We are on alert for a break either way. We did a study years back when at Fidelity on the relationship of gold to the US Dollar Index (DXY) and found you can have both dollar and gold strength for up to 3-4 months when it’s of a gradual nature.
The author or his firm have a position in mentioned securities at the time of publication. Any opinions expressed herein are solely those of the author, and do not in any way represent the views or opinions of any other person or entity.


