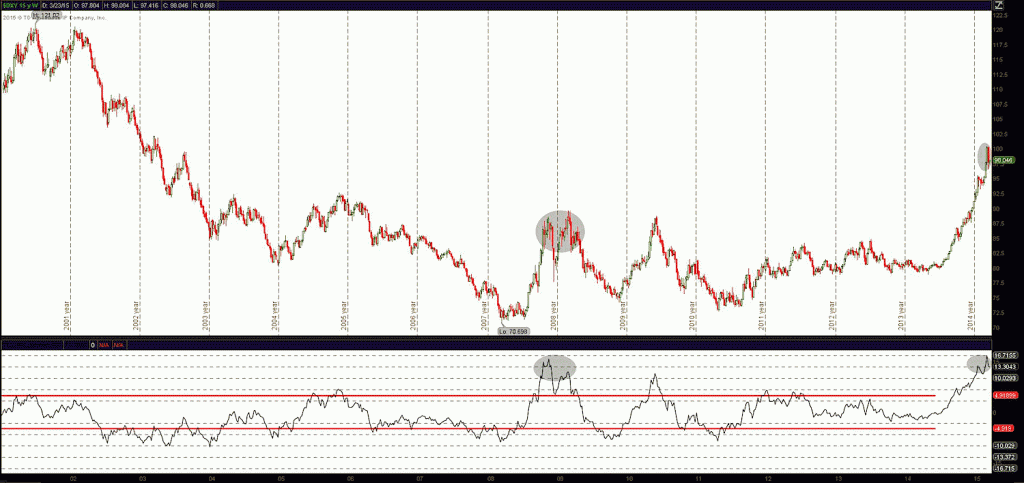
The US Dollar is finally taking a breather. Back on January 27th, I mentioned that the US Dollar Index looked exhausted after a monster run up. Since I wrote that article, the dollar rallied yet another 5% higher but has since backed off. It’s probably a good time to look at the charts again to see how are things shaping up for the US Dollar now?
Looking at the chart below, this is the most overbought the US Dollar Index has been in the last 15 years when looking at the 50 week Moving average spread indicator.
US Dollar Index Chart
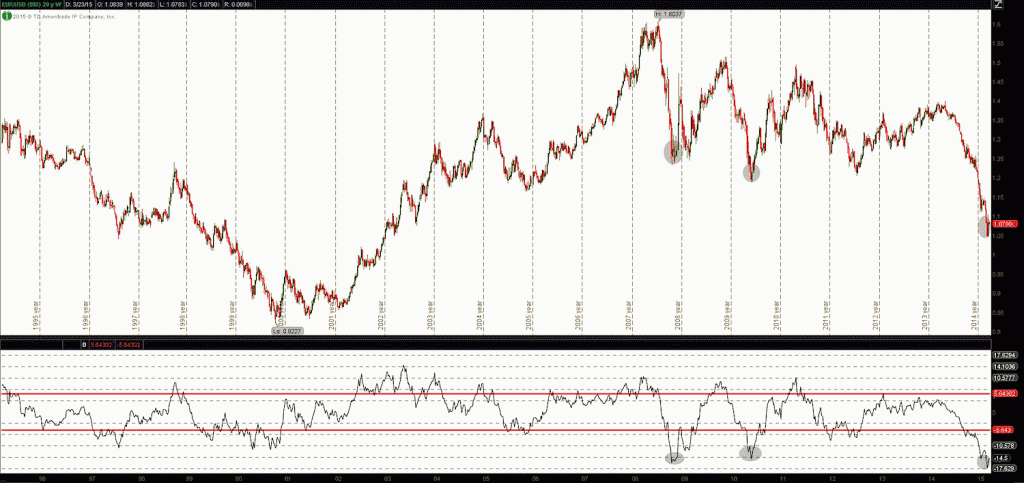
Also when looking at the EUR/USD, the chart continues to show a similar picture but in the opposite direction of the US Dollar Index. The Euro is even more oversold than it was back in January. The chart below spans a 20 year period and highlights how extreme this move has been (also with the 50 week moving average spread indicator).
EUR/USD Chart
So where do we head next? Well, I believe this is a very powerful trend higher for the US Dollar. These extreme overbought and oversold signals could possibly be a major turning point but that is yet to been seen in price action. Perhaps a speed bump correction is more in line. The strength of the trend has been undeniable… so if the trend is your friend, why fight it?
Thanks for reading and trade safe.
The material provided is for informational and educational purposes only and should not be construed as investment advice. All opinions expressed by the author on this site are subject to change without notice and do not constitute legal, tax or investment advice.
Twitter: @stockpickexpert
No position in any of the securities mentioned at the time of publication. Any opinions expressed herein are solely those of the author, and do not in any way represent the views or opinions of any other person or entity.


