Back in September of last year, I highlighted a chart pattern for the US Dollar Index that would likely slow its downside momentum.
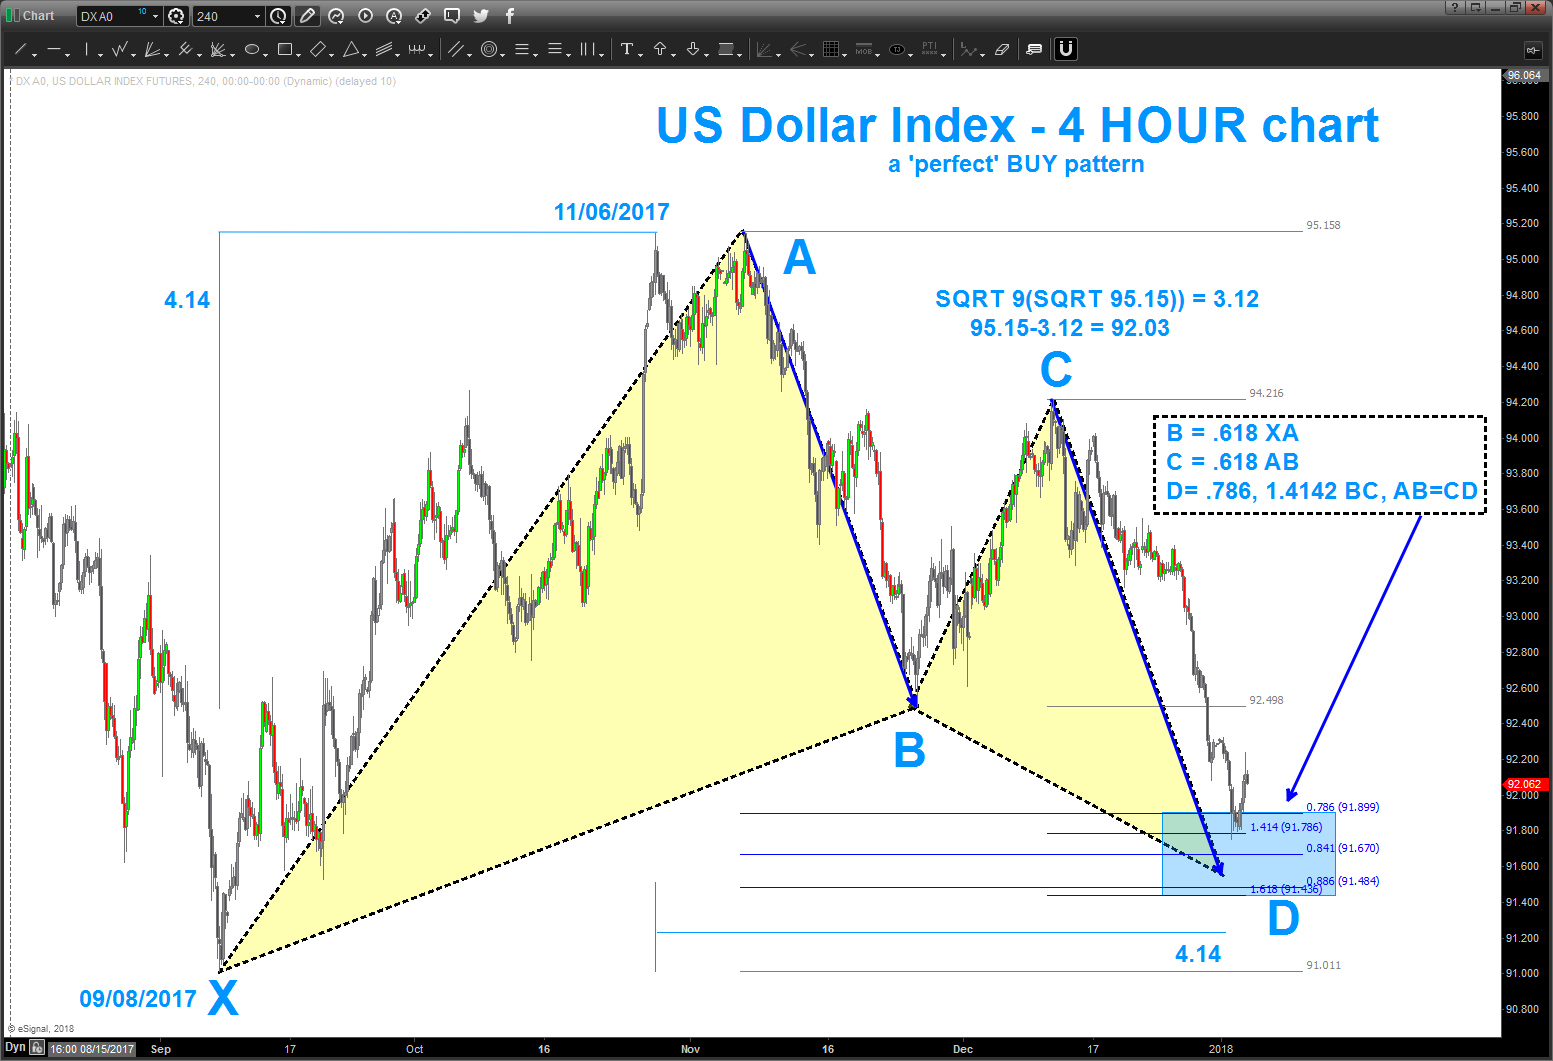
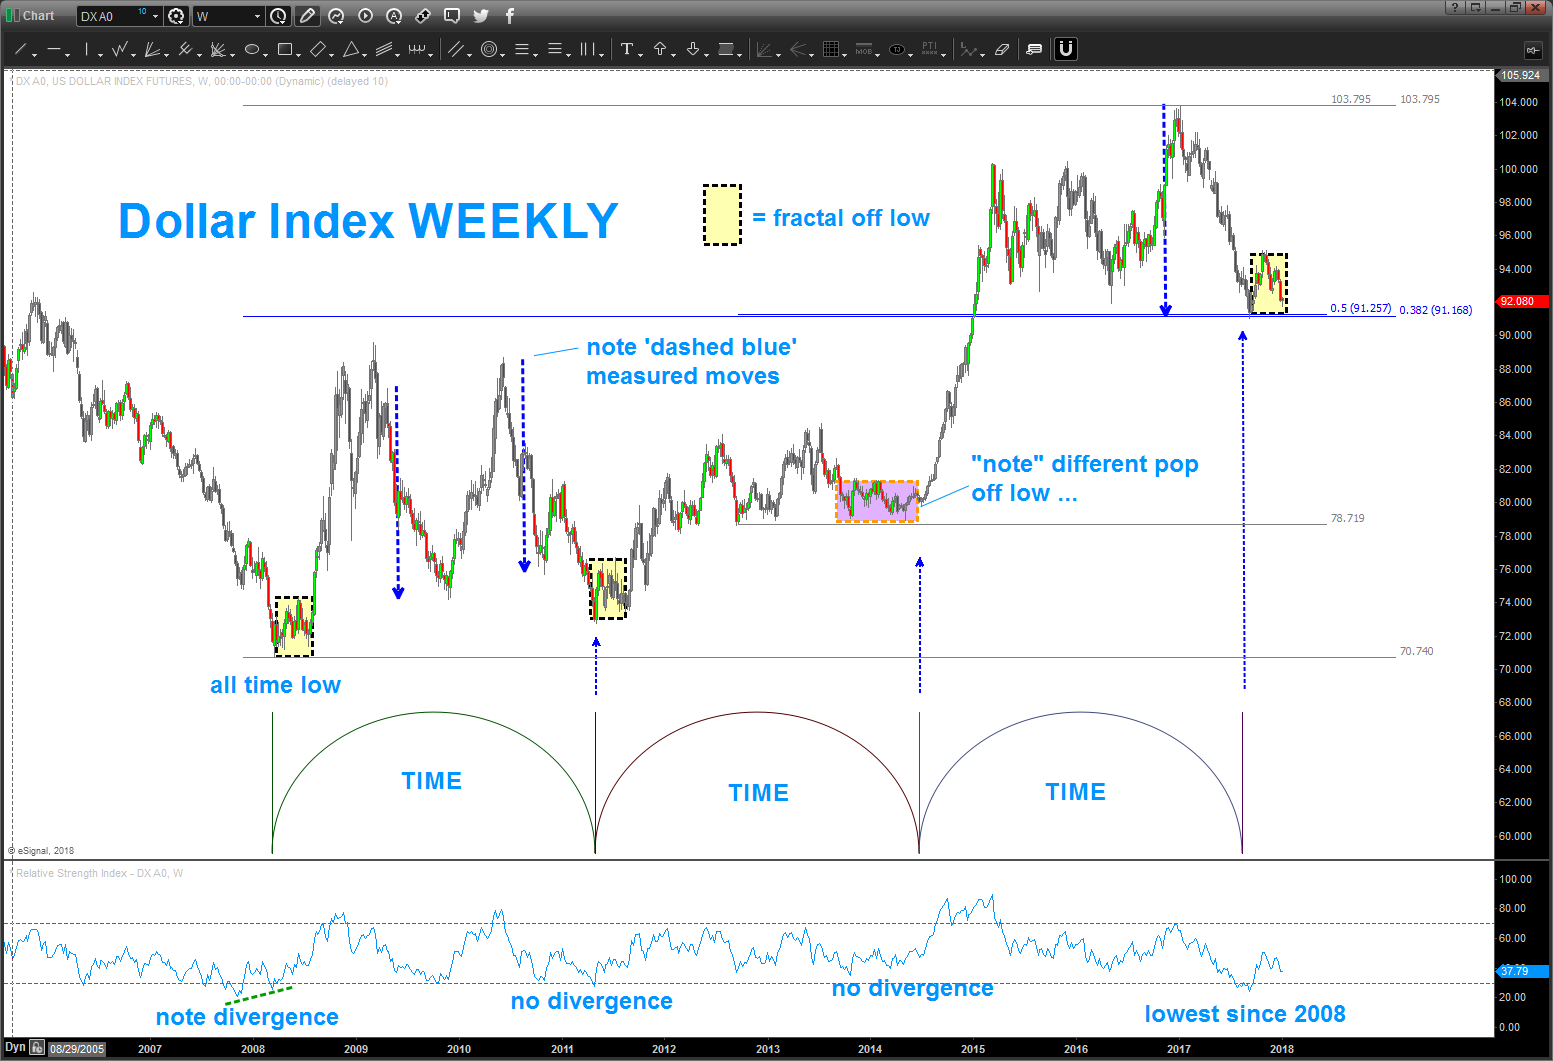
In that post, we showed a measured move, two ratios and, most importantly, the time cycle coming into play to look for a low in/around the 91 level on the US Dollar index.
That level has been hit and so far has held. But it hasn’t been pretty.
The Dollar’s bounce late last year gave way to another round of selling. And we are now at a VERY important juncture. See the chart below and consider the following:
1. There is a PERFECT BUY pattern present. However, just like the XLF sell pattern a few months ago they can and will fail! So, we are pretty much here, now, for a BUY DOLLAR. If it fails, much like the XLF took off to the upside, the dollar could accelerate to the downside – big time. So, let’s see what happens.
2. From an Elliott Wave perspective we need to determine if this is an A-B-C correction that started back in 2008 OR a 1,2,3,4,5 with a monstrous bull trend in the Dollar. One of the three rules of Elliot Wave is that 4 can not go below the end of 1… and right now, if we are in a bull trend THEN the US Dollar index can not close (weekly or monthly for me) below 89.
3. Also note the updated dashed yellow boxes from the last post… in all but 1 (the purple box) of the bounces off the cycle low they pretty much did the same thing and then took off. That fractal pattern appears to be in play here … so need to see some nice thrust and strength out of this BUY pattern to give the bulls a warm fuzzy.
The US Dollar Index is at a crucial level. Monitor this closely over the coming days/weeks. Thanks for reading!
Twitter: @BartsCharts
Author does not have a position in mentioned securities at the time of publication. Any opinions expressed herein are solely those of the author, and do not in any way represent the views or opinions of any other person or entity.


