SOYBEAN IMPACTS:
FACT – Argentina is already the world’s 3rd largest soybean exporter as of 2014/15 trailing only the United States and Brazil…
- I believe the immediate impact of a 5% soybean export tax reduction will be much less significant as it relates to substantially influencing 2016/17 Argentine planted soybean acreage for the following reasons:
- Since 2000, Argentina’s harvested soybean acreage has nearly doubled growing from 10.4 million hectares in 2000/01 (25.7 million acres) to an estimated 20 million hectares for 2015/16 (49.4 million acres). Over that same timeframe, soybean production has increased from 27.8 MMT (1,021 million bushels) to 57.0 MMT (2,094 million bushels). Even more recently Argentine soybean yields have averaged an impressive 2.73 MT/HA (43.4 bpa) over the last 3-years versus the U.S. average of 2.93 MT/HA (46.6 bpa). Why have Argentine producers been so diligent in expanding their soybean production capacity? The USDA reported in April 2015 that Argentina has the internal infrastructure to crush over 60 MMT of soybeans annually, which is 3 MMT more than the country is expected to produce in the current crop year.
- As of the November 2015 WASDE report, Argentina’s 2015/16 soybean crush was estimated at 42 MMT or 74% of its total production with exports representing just 10.75 MMT or 19%. Therefore it’s largely been the aggressive expansion of the domestic soybean crush for meal and oil that’s already incentivized Argentine producers to increase their soybean acreage bases irrespective of the government’s 35% export tax on soybeans.
- Long-term I would still expect the reduction in the soybean export tax to have a favorable impact on Argentine soybean production and export prospects over time; however the more immediate impacts will likely be felt in corn and the farmer’s ability to shift to a more consistent crop rotation without the risk of an export quota limiting his/her market opportunity.
#NoFilter: PRICE FORECAST
March Corn Futures
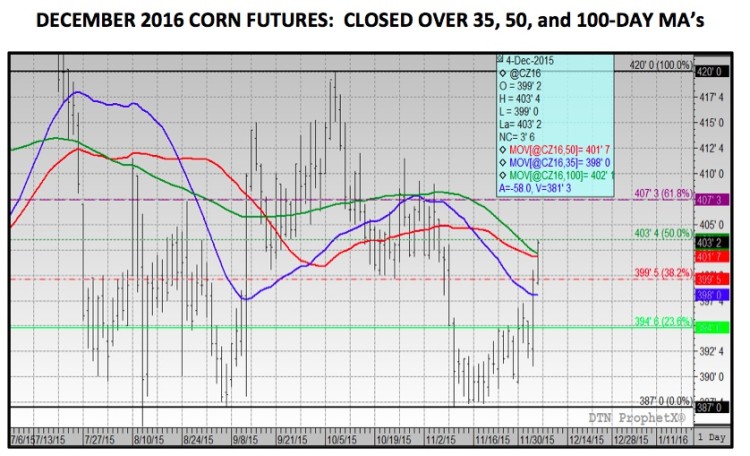
March corn futures closed a combined 11 ¼-cents higher on Thursday and Friday aided significantly by the Dollar Index collapsing during Thursday’s trading session, which ended with the Dollar closing at its lowest level since November 4th. The Dollar Index did recover slightly on Friday however it wasn’t enough to offset a continuation of Thursday’s higher price action in March corn futures. Most importantly for Corn Bulls, CH6 closed convincingly over the 35-day moving average ($3.785), which hasn’t happened since October 13th. Furthermore the most recent price action also supports the calendar year-end price seasonal, which on average has been positive over the last 5-years. In fact in 2014, with an even more burdensome US corn carryout projection versus present, March corn futures managed to rally up to a day high of $4.17 on December 29th versus the November month-end close of $3.88 ¾. I wouldn’t be surprised to see a similar type of move this year.
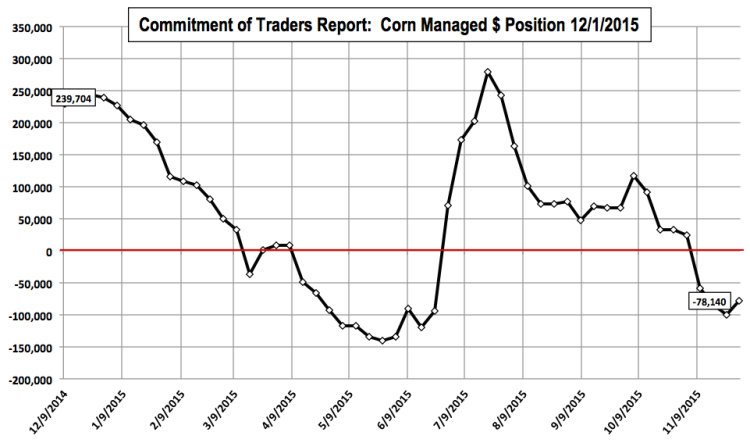
What could also help this potential trend change is the current make-up of the managed money position in corn. As of December 1st money managers were carrying a net short position of -78,140 contracts.
Looking back on 2014 the major reason corn was able to rally in December despite US corn ending stocks estimated at 1,998 million bushels in the 2014 December WASDE report was a momentous shift in the managed money position, which ballooned to a net long of 239,704 contracts on December 30th. However one key difference is the Dollar Index was trading at approximately 90.0 versus Friday’s close of 98.2. That said I still believe we’ll see money managers look to at least square their net short position exposures going into the end of December. The 5, 15, and 30-year price seasonals in March corn all support higher price action during January, February, and March. Do note that fundamentally speaking there is no reason to get bullish corn. The technicals however suggest a market that has potentially exhausted the downside. Even range bound rallies in my opinion should be used as selling opportunities with additional upside opportunities limited to long call collars.
Thanks for reading.
Twitter: @MarcusLudtke
Any opinions expressed herein are solely those of the author, and do not in any way represent the views or opinions of any other person or entity.
Data References:
- USDA United States Department of Ag
- EIA Energy Information Association
- NASS National Agricultural Statistics Service


