December 2016 corn futures managed to close up 10 ¾-cents per bushel week-on-week, finishing on Friday at $3.43 ¾. This represented the highest close in December corn since July 20th, 2016. How have corn futures managed to sustain a rally despite the release of arguably the most Bearish U.S. corn S&D profile issued just over a week ago? Let’s discuss…
U.S. Corn Demand Exhibiting Strength
With the vast majority of the market-related focus on U.S. corn yields and exceptionally strong crop condition ratings, what has been overlooked in my opinion is the continued strong performance in weekly U.S. corn export sales, as well as, U.S. corn-ethanol demand. This week’s export sales summary showed total U.S. corn export sales of 47.6 million bushels with 41 million bushels of that total representing new-crop business (2016/17). Old-crop sales (2015/16) improved to 1,960.4 million bushels, 35 million bushels above the USDA’s revised August export forecast of 1,925 million. Clearly world importers are looking to take advantage of the remarkable break in U.S. prices by locking-in future corn needs.
Furthermore, the August 2016 WASDE report also reaffirmed that Brazilian corn exports (traditionally the world’s 2nd largest corn exporter) would be down substantially in 2015/2016 and 2016/2017 from their peak of 34.46 MMT in 2014/15 (1,357 million bushels). Brazil’s 2015/16 corn exports were estimated at 17.5 MMT (689 million bushels) with 2016/17 exports pegged at 22.0 MMT (866 million bushels). Therefore the combination of economical U.S. corn values and less competition from Brazil should bode well for continued strong weekly U.S. corn export sales.
That said without question the most impressive usage sector for U.S. corn has been corn-ethanol demand. On Wednesday the Energy Information Association reported U.S. ethanol production of 1.029 million barrels per day for the week ending August 12th, 2016. This matched the previous record high run-rate from July 15th, 2016. However what’s even more impressive is that from June 3rd through August 12th weekly U.S. ethanol production has AVERAGED 1.004 MMbpd. Prior to June the U.S. ethanol industry had only achieved a weekly run-rate of 1.0 MMbpd or greater on 3 separate occasions in history.
In the August 2016 WASDE report the USDA estimated 2016/17 U.S. corn-ethanol demand of 5,275 million bushels versus 5,200 million bushels for 2015/16 and 5,200 million bushels for 2014/15. For the 2015/16-crop year (which ends on August 31st, 2016) weekly U.S. ethanol production has averaged a record 976,000 bpd versus 951,000 bpd in 2014/15. However despite the record industry run-rate and 25,000 bpd increase over 2014/15, U.S. corn-ethanol demand has thus far been unchanged versus a year ago. How is that possible?
The fact that U.S. ethanol production continues to climb without a similar linear increase in U.S. corn-ethanol demand is a reflection of the industry’s improving technology and ability to extract more ethanol from the same bushel of corn. Currently it appears the USDA is applying an ethanol yield of approximately 2.83 gallons of ethanol per bushel of corn, which is a substantial improvement from even 5-years ago. What does this mean for U.S. corn-ethanol demand? It means that future nominal increases in U.S. ethanol production will likely be satisfied by improving ethanol yields versus an increasing demand for U.S. corn as ethanol’s primary feedstock.
For example, even if we were to assume that weekly U.S. ethanol production will average an optimistic 1.0 MMbpd for 2016/17 (with a small percentage of that ethanol coming from sorghum); I would estimate U.S. corn-ethanol demand of approximately 5,330 million bushels. This would be just 55 million bushels above the USDA’s current forecast. Therefore while Corn Bulls will certainly continue to cheer record run-rates in the U.S. ethanol industry, the reality is such that future corn-ethanol demand increases beyond 50 to 60 million bushels still likely aren’t a given, nor will they prove sufficient in putting much of a dent in the USDA’s massive 2016/17 U.S. corn carryout estimate of 2,409 million bushels.
December Corn Futures Price Outlook
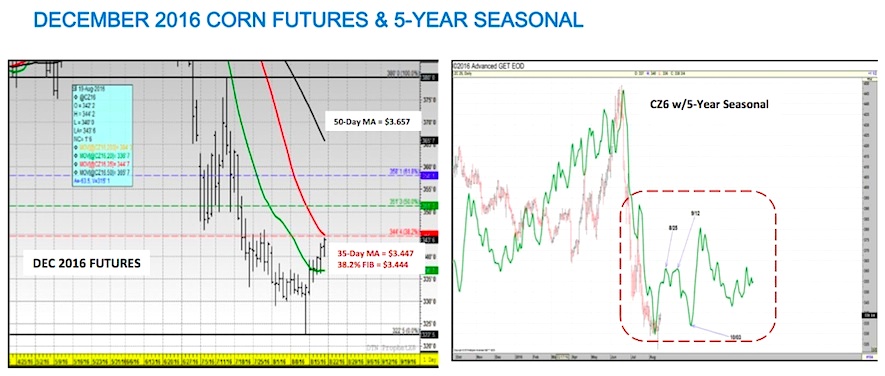
December corn futures managed a somewhat surprising higher weekly close despite the USDA’s August 2016 WASDE report revealing higher than expected 2016/17 U.S. corn yield (175.1 bpa) and ending stocks (2,409 million bushels) projections on 8/12/2016. However as I mentioned the last 2 weeks, there has been a strong seasonal tendency (see 5-year seasonal price pattern below) for December corn futures to rally from 8/12 through approximately 8/25 even during Bearish S&D crop years. Thus far that trend has continued. The question now is can this bounce in CZ6 continue past August 25th?
At present I see 2 additional price supports outside of my aforementioned references to strong U.S. corn export and ethanol demand.
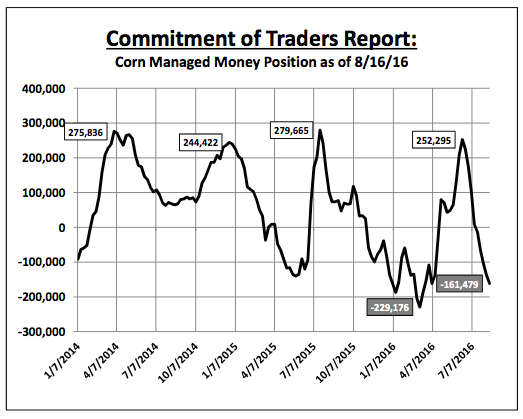
- Friday’s Commitment of Traders report showed the Managed Money net short in corn increasing to -161,479 contracts as of the close on August 16th. This is the largest short position money managers have carried since April 5th, 2016. Traditionally when corn rallies despite the presence of additional Managed Money selling, this is a fairly strong indication that an intermediate low has been scored (day low on 8/12 was $3.22 ½).
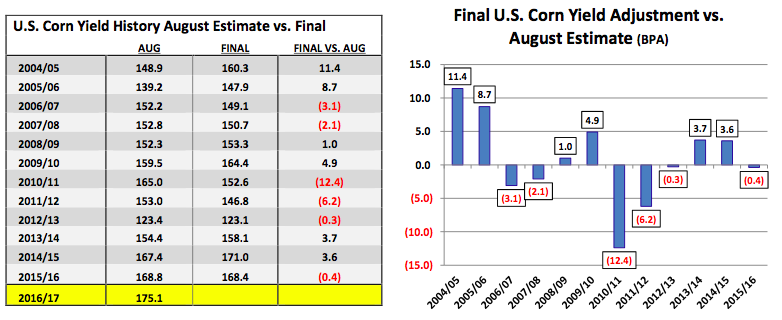
- Since 2004 the data comparing the USDA’s August U.S. corn yield estimates versus its Final assessments post-harvest shows 6 increases and 6 decreases with the largest decrease occurring in 2010/11. That year the USDA issued an August U.S. corn yield forecast of 165.0 bpa, which was eventually lowered to 152.6 bpa over time (-12.4 bpa). Therefore even in crop years lacking a legitimate weather concern, which experienced primarily ideal summer growing conditions, yield decreases AFTER the August WASDE report have been far from unprecedented.
That said CZ6 will be faced with immediate topside technical resistance Monday morning in the form of the 35-day moving average and 38.2% Fibonacci retracement at approximately $3.44 to $3.45. Additionally extended rallies back over $3.60 to $3.70 CZ6 are still unlikely at this time with U.S crop conditions ratings still record high.
Thanks for reading.
Twitter: @MarcusLudtke
Author hedges corn futures and may have a position at the time of publication. Any opinions expressed herein are solely those of the author, and do not in any way represent the views or opinions of any other person or entity.
Data References:
- USDA United States Department of Ag
- EIA Energy Information Association
- NASS National Agricultural Statistics Service


