December corn futures closed up 3.5 cents last week to close at $3.71. Do the bulls have more gas in their tank?
Let’s review current news, data releases, and market trends with a look to the week ahead (November 5).
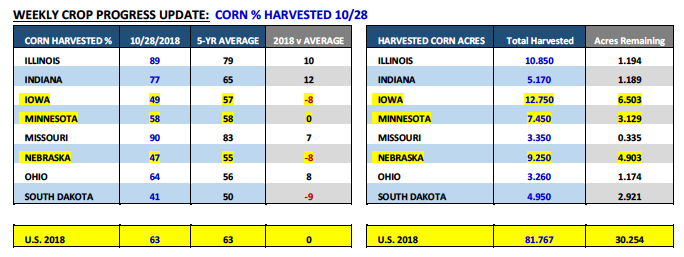
Monday’s Weekly Crop Progress report showed the U.S. corn harvest now equal to its 5-year average of 63% as of the week ending October 28th, 2018.
Iowa, Minnesota, and Nebraska all made respectable weekly harvest advances with Iowa’s corn harvest improving to 49% versus its 5-year average of 57% and last week’s estimate of 29%. Minnesota’s corn harvest percentage increased to 58%, equal to its 5-year average and up 23% week-on-week. And finally, Nebraska’s corn harvest was reported at 47% versus its 5-year average of 55% and last week’s estimate of 34%.
That said collectively those 3 states still have approximately 14.5 million corn acres left to pick, largely during the month of November, which represents 17.8% of the U.S.’s total corn harvested acreage base. NOAA’s weather forecast for the first week of November (4th-8th) shows the return of above-normal precipitation across the Corn Belt.
This could once again hinder the tail-end of this year’s corn harvest in Iowa, Minnesota, and Nebraska.
This week Brazil’s new President-elect Jair Bolsonaro issued a statement regarding his desire to see Brazil reclaim global leadership in ethanol production.
Brazil is currently the world’s second largest ethanol producer trailing only the United States. Collectively the U.S. and Brazil accounted for nearly 85% of total world ethanol production in 2017. Fast forward to present…Brazil recently passed a new bill, which will go into effect on January 1st, 2019, giving domestic fuel distributors increasing targets for annual traded volumes of ethanol and biodiesel. What’s the potential significance on the U.S. ethanol and corn markets? Brazil is the largest importer of U.S. ethanol. Total U.S. ethanol exports to Brazil totaled 428.1 million gallons in 2017.
In 2018 thus far through July U.S. ethanol exports to Brazil had already hit 364.8 million gallons. Suffice to say, Brazil’s fuel market is critical to displacing increasing U.S. corn-ethanol production. Therefore traders will continue to watch the real point of emphasis Bolsonaro places on increasing Brazil’s domestic ethanol output in 2019 and the potentially negative impact this in turn has on U.S. ethanol exports.
Earlier this week Ag Secretary Sonny Perdue said the USDA was NOT planning on extending its $12 billion aid package to farmers into 2019, which was initiated in response to China’s retaliatory tariffs on U.S. goods.
U.S. agricultural goods remain a specific target of China’s tariffs, which includes soybeans.China has traditionally been the largest buyer of U.S. soybeans accounting for more than 55% of total U.S. soybean exports in 2017. However through the first 8 months of 2018 the U.S. Census Bureau recently reported that U.S. soybean exports to China are off approximately 95%. This a result of China intentionally choosing not to buy U.S soybeans (aided in part by a 25% tariff). Since the end of May January soybean futures have broken nearly $2.40 per bushel (high-to-low) or -22%. This a byproduct of losing China as a viable export destination, as well as, the U.S. harvesting a record 2018 soybean crop.
Thursday President Trump tweeted that he had a “very good conversation” with President Xi Jinping of China, with their talks focusing on trade.
He insinuated those discussions went well with additional meetings to follow at the G20 summit in Argentina at the end of November. That was all it took for January soybeans to rally and close 30 ¼-cents per bushel higher Thursday afternoon.
December Corn Futures Trading Outlook
On Friday Informa Economics released its revised November U.S. corn yield estimate. Informa forecasted the 2018/19 U.S. corn yield at 179.7 bpa versus the USDA’s October estimate of 180.7 bpa, resulting in total U.S. corn production of 14.698 billion bushels.
That would represent an 80 million bushel decline versus the USDA’s October production figure of 14.778 billion bushels. FCStone also revised its U.S. corn yield estimate to 181.4 bpa for total production of 14.830 billion bushels.
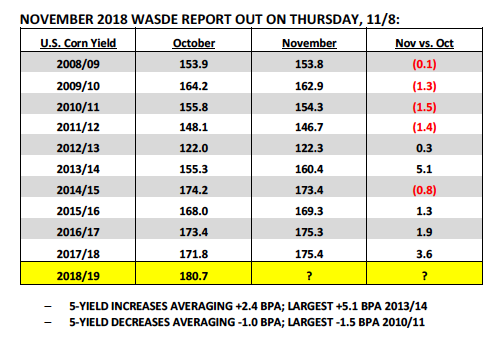
That said there’s a growing market consensus that the USDA will likely lower its 2018/19 U.S. corn yield estimate in next Thursday’s (11/8) November 2018 WASDE report.
This despite the USDA increasing the U.S. corn yield from October to November in 5 out of the past 6 years. Why the decrease? Based on first-hand, corn harvest results that I’ve received I’m of the strong opinion that disappointing corn yields in sections of Iowa, Minnesota, and South Dakota will invariably pull the national corn yield down in the November report by as much as 1 bpa. In October Iowa’s corn yield was estimated at a record high 204 bpa, Minnesota 191 bpa, and South Dakota 172 bpa. I believe both Iowa and South Dakota are currently 1 to 2 bpa too high with Minnesota’s yield 3 to 4 bpa too high.
I’ll acknowledge that the Eastern Corn Belt is as good as advertised; however I’m of the assumption that those yields were already largely reflected in the October Production report. Therefore I do see as a very real possibility, the U.S. corn yield drifting below 180 bpa in either the November or January WASDE reports.
How much could a 1 bpa decrease in the national corn yield rally the corn market? That’s hard to answer considering rallies have historically proven difficult to sustain during the month of November.
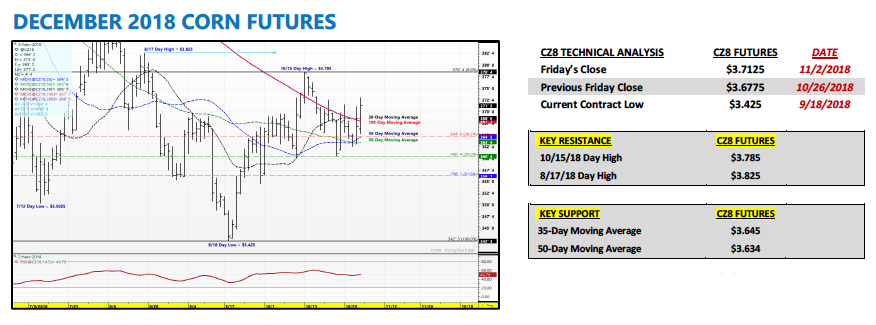
The 5, 15, and 30-year price seasonals in December corn futures all support sideways to lower price action into and through theend of November. From a supply and demand standpoint, an 80 million bushel decrease in production still leaves 2018/19 U.S. corn ending stocks at an adequate 1.73 billion bushels. Therefore I’m willing to concede a possible retest of the 8/17 day high of $3.82 ½ on a “Bullish” November U.S. corn yield adjustment, however I don’t foresee rallies extending beyond the 200-Day Moving Average of $3.86 ½. The key takeaway then being that if we see a November rally in CZ18, I’m expecting it to be measured…and likely short-lived.
Twitter: @MarcusLudtke
Author hedges corn futures and may have a position at the time of publication. Any opinions expressed herein are solely those of the author, and do not in any way represent the views or opinions of any other person or entity.
Data References:
- USDA United States Department of Ag
- EIA Energy Information Association
- NASS National Agricultural Statistics Service


