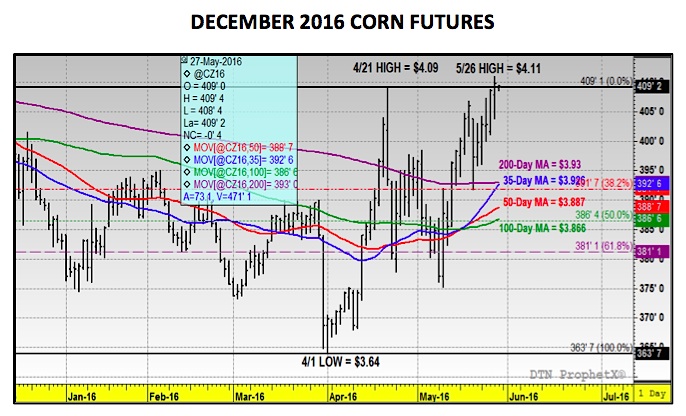
Corn summary and price outlook:
December corn futures traded up over 13-cents per bushel week-on-week, closing at a new 2016 calendar year high at over $4.13.
Last Monday’s Crop Progress report showed U.S. corn planting progress improving to 86% as of May 22nd versus 90% in 2015 and the 5-year average of 85%. The planting estimate was on the lower end of trade expectations; however it still fell within the range of percentages from prior record corn yield years. In 2014 (record corn yield of 171.0 BPA), 88% of the U.S. corn crop was planted as of May 25th. In 2009 (previous record corn yield of 164.4 BPA), 82% of the U.S. corn crop was planted as of May 24th. Therefore the ability to optimize U.S. corn yield potential is still certainly in play even with approximately 12.7 million corn acres needing to be planted.
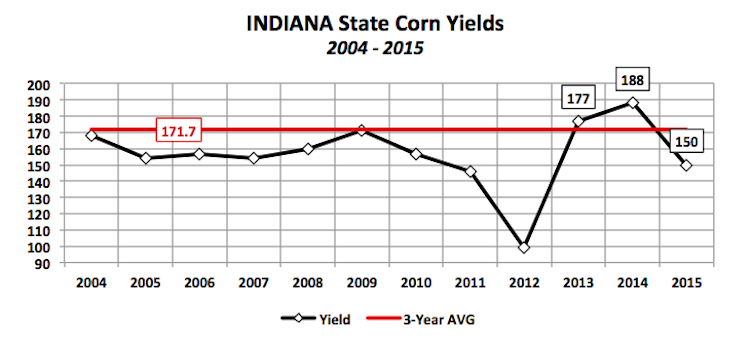
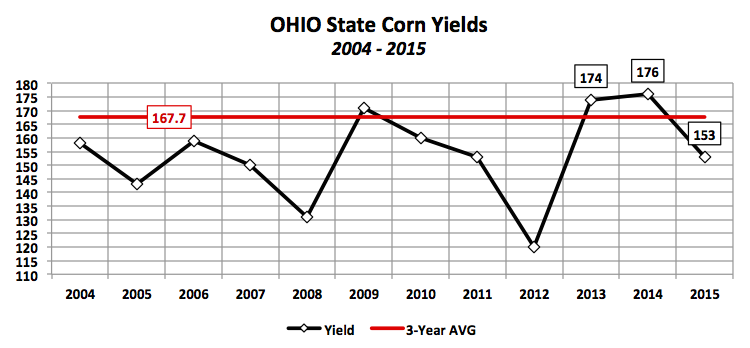
That said if there is an area of concern it is in the Eastern Corn Belt. Both Indiana and Ohio remain well behind schedule. Indiana was reported at 62% planted versus 84% a year ago and the 5-year average of 77%. Meanwhile Ohio was just 51% planted versus 84% in 2015 and the 5-year average of 66%. Both states are crucial in my opinion to the U.S. achieving a trend or slightly above trend-line national corn yield (above 168 bpa).
In the March 31st Prospective Plantings report, Indiana’s planted corn acreage was estimated at 5.8 million acres, making it the 5th largest corn state in the U.S. by area. Ohio came in at number 10 via total planted acreage of 3.55 million acres. More importantly however, when the U.S. was achieving its record corn yield in 2014 both Indiana and Ohio were also in the process off carving new record state corn yields of 188 bpa and 176 bpa respectively. That said both states not only represent a tangible percentage of the total U.S. corn planted acreage base, but they also produce exceptional yields when growing conditions are optimal. Conversely, as a point of reference, North Dakota’s planted corn acreage was forecasted at 3.4 million acres for 2016, just 150,000 acres less than Ohio. However, North Dakota’s record state corn yield is 132 bpa (2010). Therefore Ohio has the ability to out-produce North Dakota by approximately 140 million bushels even when their harvested acreage bases are equalized at approximately 3.18 million acres. For this reason alone, I believe the corn market will place slightly more of an emphasis on planting progress being behind in Indiana and Ohio rather than it being ahead nationally versus the 5-year average.
What will be the key price drivers for corn futures during the first two weeks of June?
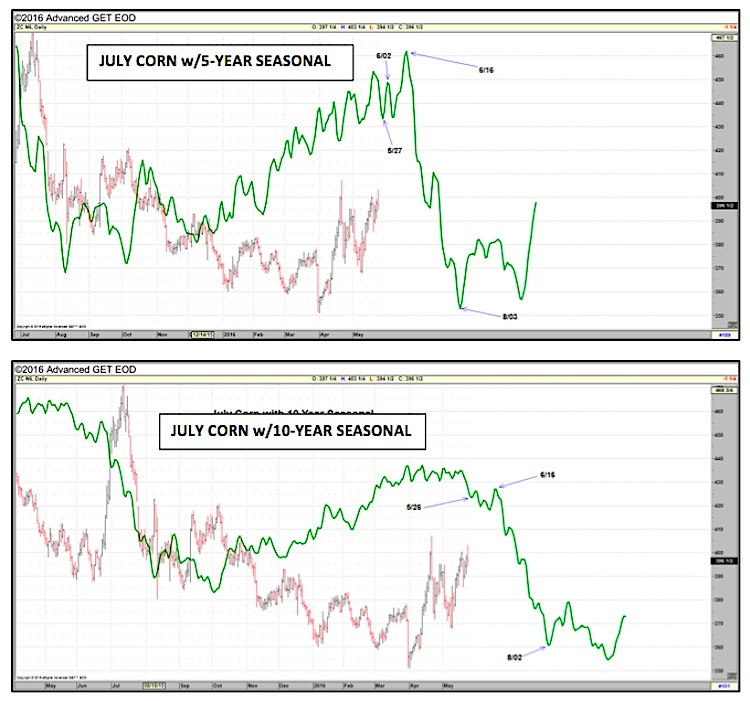
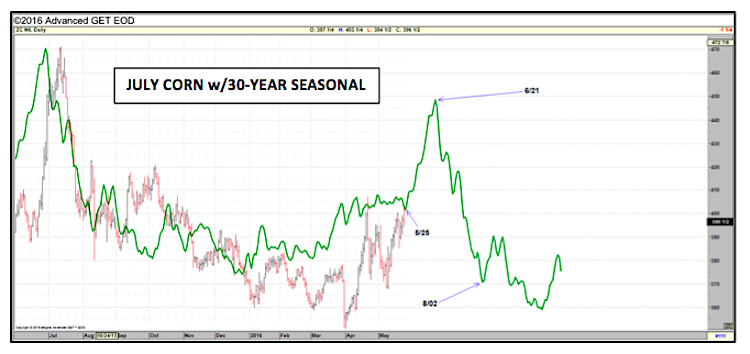
I still believe corn futures will ultimately gravitate toward the direction of the underlying price seasonal. The question is will it be the 5, 10, or 30-year seasonality price pattern that proves to be the primary price influence? The 5 and 10-year both suggest a sideways pattern into the middle of the month before turning decidedly lower on approximately June 16th (more volatility noted in the 5-year; see charts further below). The 30-year pattern however is aggressively higher into June 21st – 24th. Based on recent price action it appears the path of least resistance is still higher and therefore more in-line with the 30-year pattern. However as a point of caution to Corn Bulls I would also reflect on the following price considerations:
- Even if the 30-year price seasonal proves to be the strongest underlying market force, Corn Bulls still need to define just how high corn can rally in June given current U.S. corn ending stocks. In the May 2016 WASDE report, 2016/17 U.S. corn ending stocks were forecasted at 2,153 million bushels. Does that type of carryout support $4.25 to $4.50 December corn futures? It should be noted that in October of 2014 (when December corn futures were in the process of trading under $3.20 per bushel) the 2014/15 U.S. corn carryout was estimated at 2,081 million bushels, 72 million bushels LESS THAN the USDA’s current stocks estimate for 2016/17. And yet last week December corn futures traded over $4.13 per bushel.
- For the contrarians already arguing my first point, I’m more than willing to concede the material difference between the price response to a +2 billion bushel U.S. corn carryout in October 2014 and May 2016 has everything to do with timing. Clearly this year’s +2.0 billion bushel carryout assumption is predicated on the U.S. achieving a 168 bpa yield or better. The fact is it’s not even June and the uncertainties of La Niña, a summer drought, and/or early frost-freeze event all of which could lower the yield over time are still entirely in play. In October of 2014 the yield had already essentially been defined, therefore the carryout was much more real versus theoretical. That said I still believe there’s value in understanding where prices are likely headed IF this summer’s weather proves to be a non-factor and a +2.0 billion bushel carryout becomes the expectation. In just the last several days, a number of the long-range (Jul-Aug) weather models have shifted to a warm and wet weather pattern for the U.S Midwest with less of an emphasis on La Niña. This is an important observation considering in the not too distant future the market will shift aggressively from trading primarily hypotheticals to actuals. Remember, Bullish momentum is often fueled by speculation over “unknowns.” Once those “unknowns” are eliminated, commodity markets tend to go through a downward correction, regardless of the implied price impact of the actual event having taken place.
- The major outlier to every fundamental justification I seem to be providing for lower corn prices over time (outside of a legitimate summer drought) is the direction in the U.S. Dollar Index and its influence on crude oil and commodity values in general. To fully appreciate the impact of the Dollar Index on commodity prices, look no further than crude oil. Since breaking to a day low and 12-year low of $26.05 per barrel on 2/11/16, crude oil has managed to rally back over $50 per barrel. What oil specific bullish S&D adjustment initiated the price change? I can’t find one. Statistically speaking U.S. crude oil stocks have INCREASED 2.7% since making that day low in February. However what has changed? The Dollar Index has finally shown some measure of sustained weakness after trading up to a 12-year high of 100.51 on December 2nd, 2015. In my opinion the weaker Dollar has signaled to Managed Money investors that commodity prices, regardless of their respective S&D profiles, are essentially undervalued. This view has been further supported with U.S. corn and soybean exports improving dramatically over the last 30 to 60 days (cheaper Dollar makes U.S. exports more competitive).
Where does this leave us then for corn prices for June? From purely a supply and demand standpoint (and that assumes a lower Brazilian corn production estimate and higher U.S. corn exports in the June Crop report) I can’t justify a rally in December corn futures beyond $4.25 to $4.50. However the major disclaimer in my analysis is simply this, at times the fundamentals are completely irrelevant due to other Macro-Market forces taking over. The truth is price discovery has become much more complicated in commodities with the range in corn prices now essentially $5.00 per bushel, $10.00 per bushel in soybeans, and $120 per barrel in crude oil (since 2008). With more and more money flowing into commodities, there is now often a disconnect between the direction in futures prices and basis values. The futures market has become an investment mechanism for pools of money whereas the physical cash basis still determines the real price end users pay. And right now they are moving in opposite directions…
Thanks for reading.
Twitter: @MarcusLudtke
Author hedges corn futures and may have a position at the time of publication. Any opinions expressed herein are solely those of the author, and do not in any way represent the views or opinions of any other person or entity.
Data References:
- USDA United States Department of Ag
- EIA Energy Information Association
- NASS National Agricultural Statistics Service


