Over the weekend I showed you a weekly chart of Bitcoin.
That chart showed how clutch this week would be for the coin as the price held the 50-week moving average and needed to continue to do so.
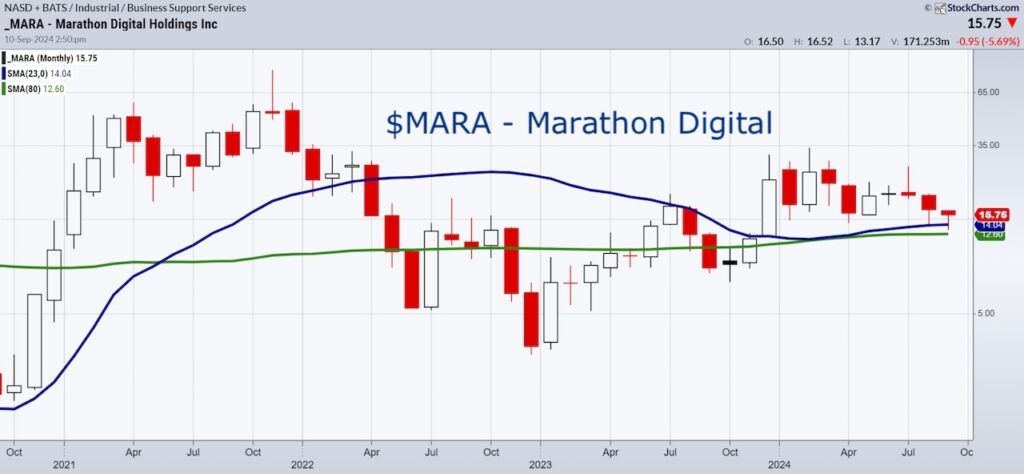
For today, with Bitcoin holding support, we look at Marathon Digital Holdings Inc. (MARA).
This is a monthly chart with the 2 moving averages we rely on for denoting business cycles.
The blue line is the 23-month MA or about a 2-year business cycle.
The green line is the 80-month MA or about a 6-8-year business cycle.
Monthly charts are a great way to look at the start of a much bigger trend.
Note that the interview I did with Maggie Lake on September 9th (link below under Media) mentions this stock as a buy and talks more about what I am watching in the crypto space.
Incidentally, BITO, the ProShares ETF, has a similar look to MARA.
MARA cleared the 80-month MA in 2021.
In April, the 23-month MA crossed the 80-month MA, which is bullish.
However, as interest rates rose precipitously in 2022, the stock faltered.
In October 2023, MARA cleared back over both MAs.
And now as we have seen throughout 2024, the price holds both the longer and shorter-term business cycle moving averages.
That makes it look ripe for a move higher.
Plus, the risk is quite clear to under the 2024 lows, which we just made this week.
Hence, the question on whether this is the bottom for the year and the start of a much bigger move higher.
Twitter: @marketminute
The author may have a position in mentioned securities at the time of publication. Any opinions expressed herein are solely those of the author and do not represent the views or opinions of any other person or entity.
: Creating Bullish Divergence?")

 and Semiconductors (SMH): Concerning Price Pattern?")
 and Semiconductors (SMH): Concerning Price Pattern?")


