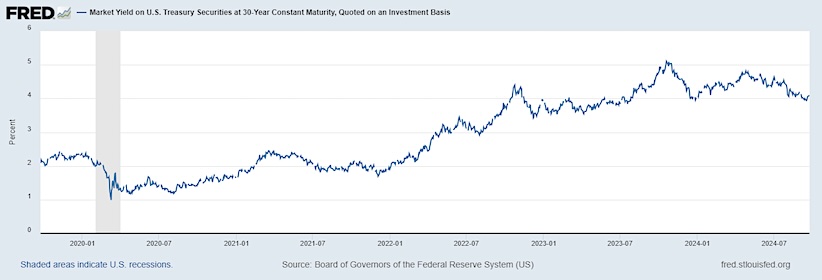
Instead of falling after the Fed lowered rates, the 10-year and 20+ year yields have risen.
This seems incongruous given the dovish Fed talk.
However, a lot of the cuts were baked into the bonds ahead of the announcement.
How many times have we traders seen a “sell the event” situation?
However, what matters more is what happens from here.
We continue to see “soft” economic data hinting at a slowdown.
While at the same time, many commodities are rallying with news of the China stimulus, geopolitical strife, and weather disturbances.
Plus, we are now hearing talks of more rate cuts on the way this year.
First, I doubt that the 10-year yields will rise much more from current levels.

In this chart you can see the rise in rates on the 30-year bonds.
More importantly, you can track the yields to see if this rise since the Fed cut, reverses or continues.
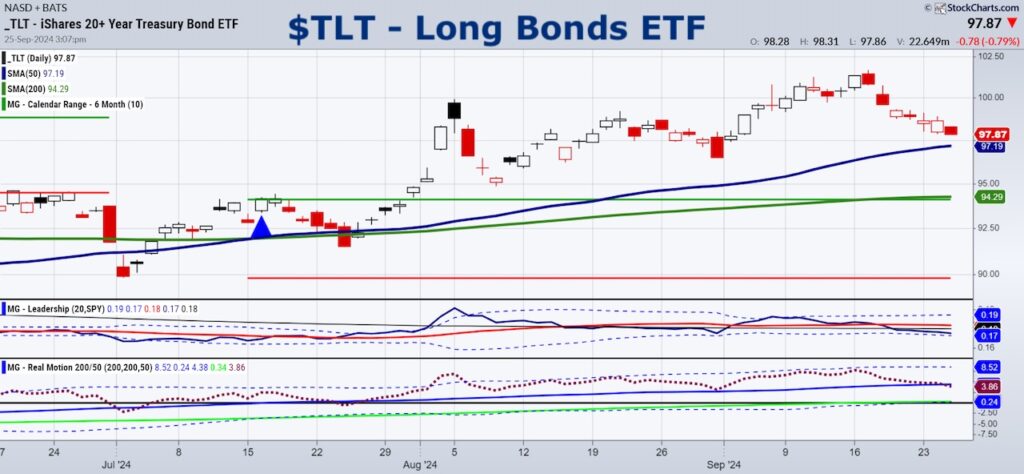
With TLT still above the 23-month moving average and sitting on daily chart support, what should we watch for?
First, we must watch to see if the 50-day moving average holds up.
The price is near enough to consider that level our main support (97.20).
Secondly, TLT had an inside day, which means it traded today inside the trading range of yesterday. A move over 98.89 would be bullish.
Third, momentum weakened some showing a bearish divergence. Hence of break of 97.85 can take it down to the 50-DMA.
TLT is currently underperforming SPY, which is good for the market and risk on.
This is why it is so important to watch these long bonds.
A rally in TLT and a potential outperformance of the benchmark could be negative for the dollar and equities, while positive for emerging markets and commodities.
Twitter: @marketminute
The author may have a position in mentioned securities at the time of publication. Any opinions expressed herein are solely those of the author and do not represent the views or opinions of any other person or entity.


