The financial markets are getting volatile here. Stocks are gyrating around lower levels, bonds are still suppressed yet volatile, and crypto is beaten down.
To put it clearly, the markets are on edge.
Today, we take a simple (yet important) look at long-dated treasury bonds (the ETF $TLT). As most of you know, bond prices trade opposite of yields (interest rates). So if bonds are falling, interest rates are rising.
Well, bond prices are setting up for a big move. And this could add more volatility to the financial markets.
Note that the following MarketSmith charts are built with Investors Business Daily’s product suite.
I am an Investors Business Daily (IBD) partner and promote the use of their products. The entire platform offers a good mix of analysts, education, and technical and fundamental data.
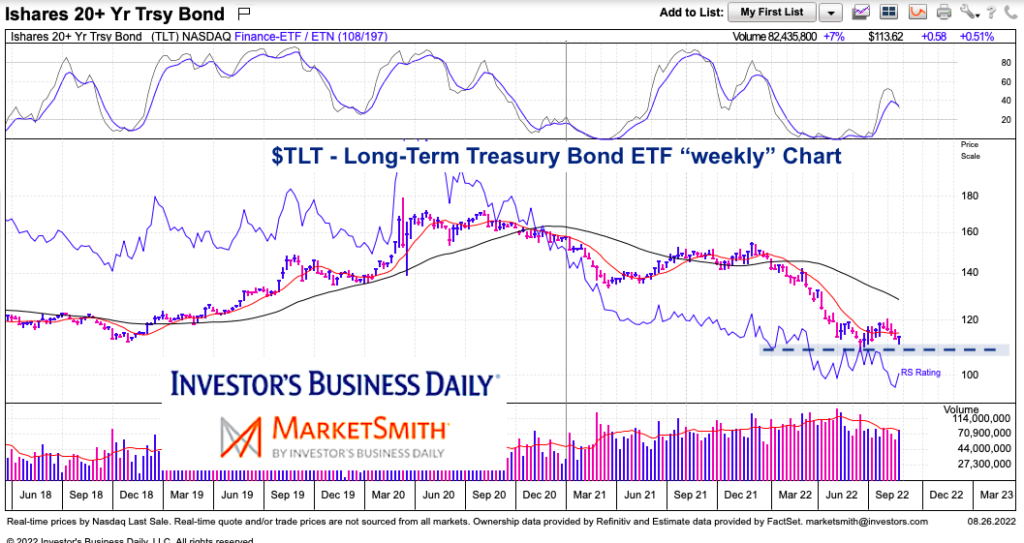
$TLT Long-Term Treasury Bonds “weekly” Chart
As you can see, TLT is dipping down to retest its recent low. If this bond ETF continues to new lows, it could send rates rocketing higher yet again. Make no mistake, this is another important juncture for bonds.

Twitter: @andrewnyquist
The author may have a position in mentioned securities at the time of publication. Any opinions expressed herein are solely those of the author, and do not in any way represent the views or opinions of any other person or entity.


