The current environment for treasury bonds remains favorable for upward trades in the near term, with the biggest consideration being the time frame that an individual trader is working in.
We expect to see upward moves lasting a few days and others lasting several weeks. The great thing about Elliott wave technical analysis is that the same set of charts can provide guidance for people trading on a daily basis or just once per month.
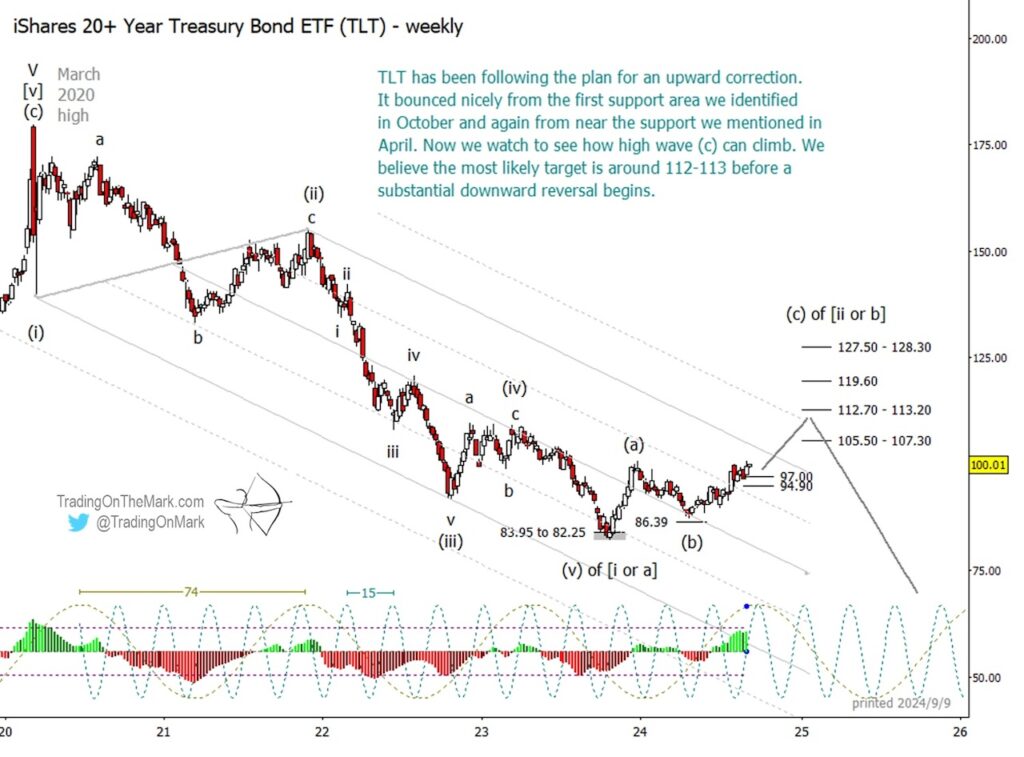
In our previous posts last April and last October about the iShares 20+ Year Treasury Bond ETF (NYSEARCA:TLT), we alerted readers to some Elliott wave price support areas that were likely to produce substantial bounces. The price supports worked well and are shown on the weekly chart below. Now we’re watching for opportunities for continuation trades on daily and weekly time frames, although we’re being a bit more cautious about it.
On the slower side of trading, considering moves that span several weeks or months, upward Elliott wave (c) can probably reach as far as the 105-107 area or (better) the 112-113 area. Looking at the combination of currently dominant price/time cycles of 74 weeks and 15 weeks, it’s reasonable to expect the general trend to be upward until late 2024 or early 2025.We’re treating the upward pattern that began in autumn 2023 as a corrective formation that will bridge between two strong and lengthy downward impulses, the first of which lasted from 2020 until 2023. It’s unclear whether the correction represents a wave [b] or a wave [ii], but the implications for trading are basically the same.
For those who look for trading opportunities on the time frame of weeks, we’d suggest watching for a possible pullback later this year as wave ‘iv’ within wave (c). We have drawn a sketch of the expected path on the daily chart below.
The TLT market has some support areas at 97.00 and 94.90 that have not yet been widely noticed by the crowd and that should have an effect when tested. From there, we think the best target area for a rise as wave ‘v’ of (c) is near 112.70 – 113.20, but there is also a resistance zone near 105.50 – 107.30 that price might struggle against.If TLT bounces from the support area we mentioned, then it will be important for a bullish trader to monitor the wave count within wave ‘v’ to watch for completion of the small impulse. (Regardless of the scale/magnitude of the fractal pattern, impulsive moves always have five waves.)
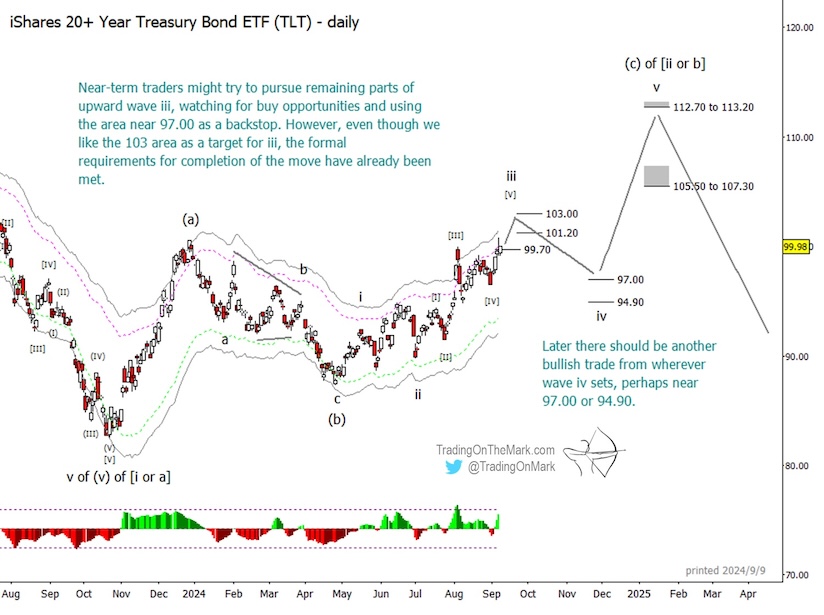
Daily and intraday traders might consider looking for brief opportunities with pullbacks during the next one or two weeks. The formal conditions for completion of wave [v] of ‘iii’ have already been met, but it appears to us that the small move can extend a little higher to test the areas near 101.20 or 103.00 before running out of steam.
Now that trading is ramping up after Labor Day, Trading On The Mark is offering a subscriber special. Sign up for our daily newsletter and get 20% off the price for as long as you maintain the subscription. You can also inquire about our intraday service, which is more customized.
Twitter: @TradingOnMark
The authors may have a position in the mentioned securities at the time of publication. Any opinions expressed herein are solely those of the author, and do not in any way represent the views or opinions of any other person or entity.


 Pressuring Lower Price Support")