It’s been a volatile end of the month, to say the least.
Stocks are on the ropes and investors are getting sweaty.
So bonds must be up a lot, right? There’s gotta be some flight to safety going on, right?
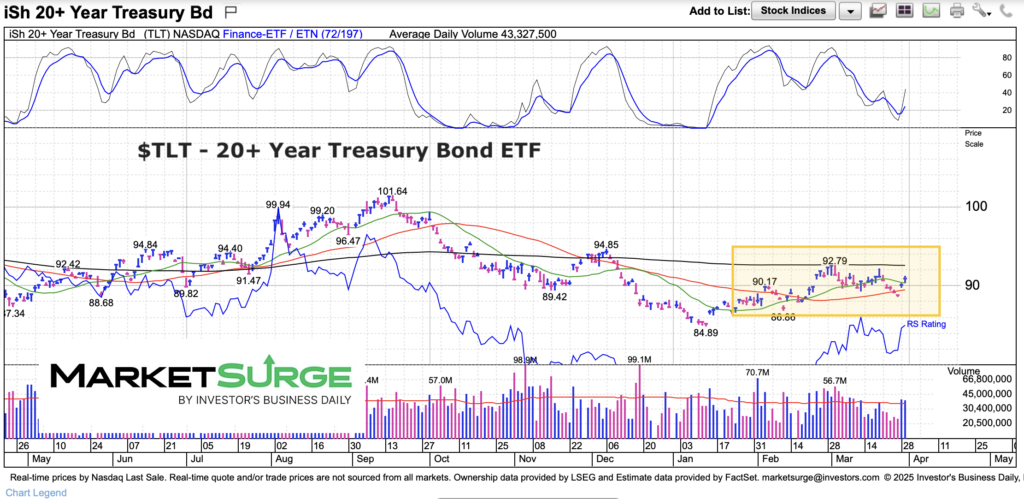
Well, that hasn’t played out. At least not in any meaningful way. Today we look at the 20+ Year Treasury Bond ETF (TLT) to show just how muted the response has been.
Note that the following MarketSurge charts are built with Investors Business Daily’s product suite.
I am an Investors Business Daily (IBD) partner and promote the use of their products. The entire platform offers a good mix of tools, education, and technical and fundamental data.
$TLT 20+ Year Treasury Bonds Chart
So we’ve seen a bit of a bounce since January but nothing much here in March. We would need to see a sustained move above both the 200-day moving average and the December high (94.85) to start to believe in bonds (and the idea of lower rates).
Twitter: @andrewnyquist
The author may have a position in mentioned securities at the time of publication. Any opinions expressed herein are solely those of the author, and do not in any way represent the views or opinions of any other person or entity.


 Is Telling Broader Stock Market?")
 Trying to Bottom?")

