To continue the trade review series, here’s the next installment; another day trade on the short side – this time a quick Twitter stock trade (TWTR).
The purpose of these reviews is to show you many different types of patterns that appear in the market and how to recognize and ultimately trade them. It’s one thing to see a pattern in a textbook, it’s quite another to see it in real-live trading.
Therefore, this is the purpose; to help show more real-live trading examples of patterns that are tradable and less “cookie cutter” patterns seen in textbooks.
This pattern is a little more complex than that of the last trade review (see $NEM trade here), however, the general concept is the same as it is also a short trade.
Here’s a bullet form of my thought process before entering my Twitter stock trade:
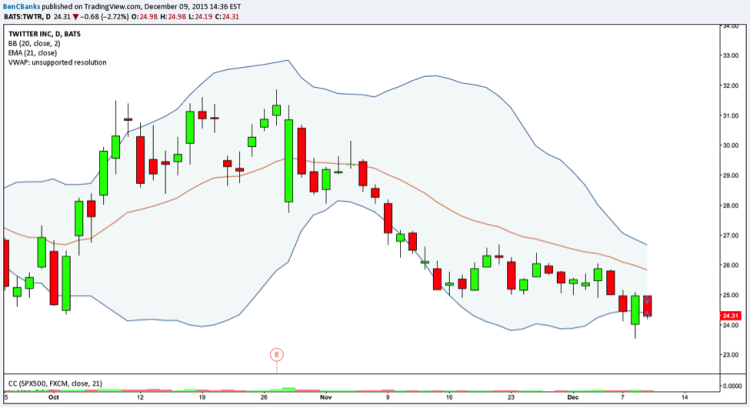
- Daily chart is terribly broken and weak, the stock is down trending and doesn’t show signs of becoming stronger
- Also, it recently broke the major level of 25.00 support and was now hold below
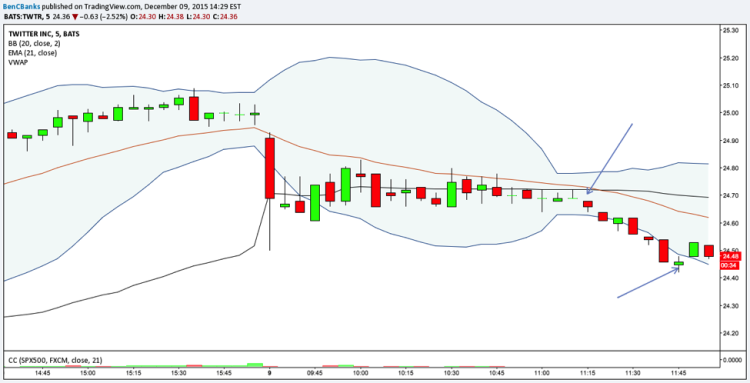
- Intraday (today, 12/9/15); the market was trading higher and higher- making new highs in the morning, but meanwhile Twitter (TWTR) went lower right at the open then couldn’t rally at all. It held lower all morning long, despite the strength in the overall market. This was the first major signal to me that there could be a short trade in this stock today.
- Once the weakness was recognized, the next step was to see if there was any price contraction associated with this weakness, which would act as fuel to any future move (up or down). I use the Bollinger bands to determine how contracted a stock is.
- Later in the morning, we got the signal, there as price contraction along with relative weakness in a stock that was already weak, the recipe for a trade was almost complete.
- The final dagger in the set-up was when TWTR failed to rally once last time (see candle before the first arrow) within the price contraction. The stock tried to break out higher and join the rally but failed, signaling to me that the stock likely was ready to pull in more.
- I entered the trade short @ 24.65 (see arrow) on the 5-minute chart and set a stop loss @ 24.81 (above the price contraction). Now I waited….
Now that I am in the trade, the hard part begins; following actively the stock and being strategic in exiting. My exit today on this Twitter stock trade wasn’t great, but it was justified. Here’s the thought process:
- As Twitter (TWTR) began to break lower, I lowered the stop down to the entry point to cover risk…
- My target is often a moving one when I trade intraday, depending on how quickly the stock moves downward/upward, if it’s quick, the target will be a lot smaller (in terms of profit) and vise versa. In this case, the stock was moving pretty fast so I was setting a target just below the low of the day (24.50 at the time), making the target 24.49.
- However, as the stock traded longer and it took longer to break down, I moved the target lower; down to 24.45 as it was not oversold by any measures yet and I was expecting a flush before a bounce back.
- This is exactly what transpired; the stock traded down to the 24.45 level(ish), I covered the position and then the stock bounced.
- Trade complete.
Hindsight 20/20, I should have covered half of this trade on the flush lower because later in the day the stock traded even lower. However, it’s hard to trade like this; following the rules and process outlined before the trade is initiated is more important than anything else.
Here are the charts:
Twitter Stock Trade Chart (5 Minute) – TWTR
Twitter Daily Chart – TWTR
If you have any questions, feel free to shoot me an email. I will likely continue this series for a time period longer, at least to get at least one trading loss in the mix to show what happens when a loss occurs and what I did wrong/right in that regard.
Thanks for reading.
Twitter: @BenCBanks
Any opinions expressed herein are solely those of the author, and do not in any way represent the views or opinions of any other person or entity.


