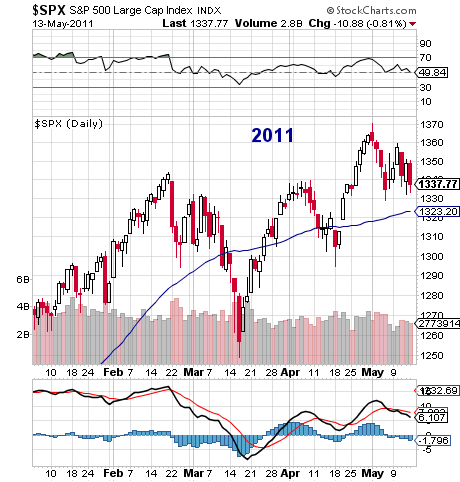
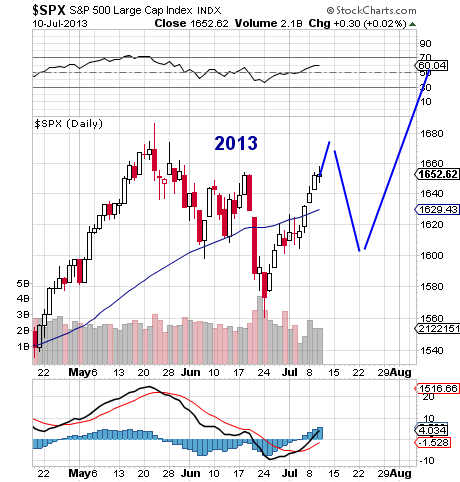
 As I was looking through some charts last night, I stumbled upon a potential topping pattern (or algo) that the current market may be pacing with. It’s a bit rudimentary in form, but it doesn’t take much imagination to see how this topping pattern could play out.
Looking at the February/May topping pattern from 2011 and putting that on top of the current market formation, and we would see a retest of the highs (roughly 1680), followed by a pullback to 1620ish, followed by another burst higher to over 1700 (to roughly 1740). Food for thought – See charts below.
S&P 500 2011 Topping Pattern
S&P 500 2013 Pattern
Thanks for checking in. Trade safe, trade disciplined.
Twitter: @andrewnyquist and @seeitmarket
No position in any of the mentioned securities at the time of publication.


