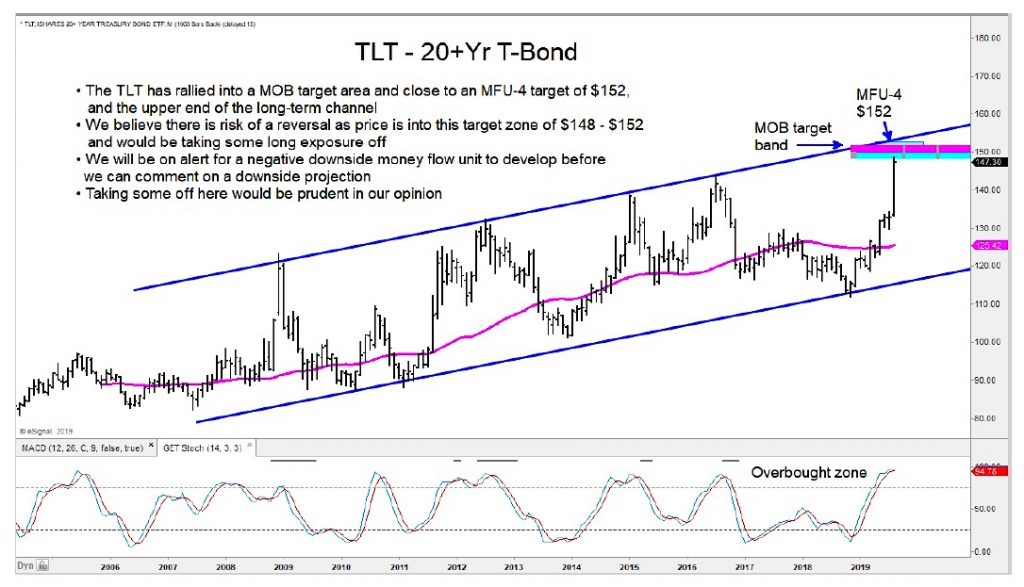
20+ Year Treasury Bond ETF Price Chart – NASDAQ: TLT
Treasury bonds have soared in August and are nearing a critical price resistance target.
Perhaps even a spot for a peak for the long-dated treasury bonds ETF (TLT).
The TLT is approaching a key price target zone of $148 – $152 based on my money flow work and the Make or Break (MOB) target band.
The ETF is also very close to the upper end of 10-year channel. I would be looking to trim long exposure into this zone.
The author may have positions in mentioned securities at the time of publication. Any opinions expressed herein are solely those of the author, and do not in any way represent the views or opinions of any other person or entity.


