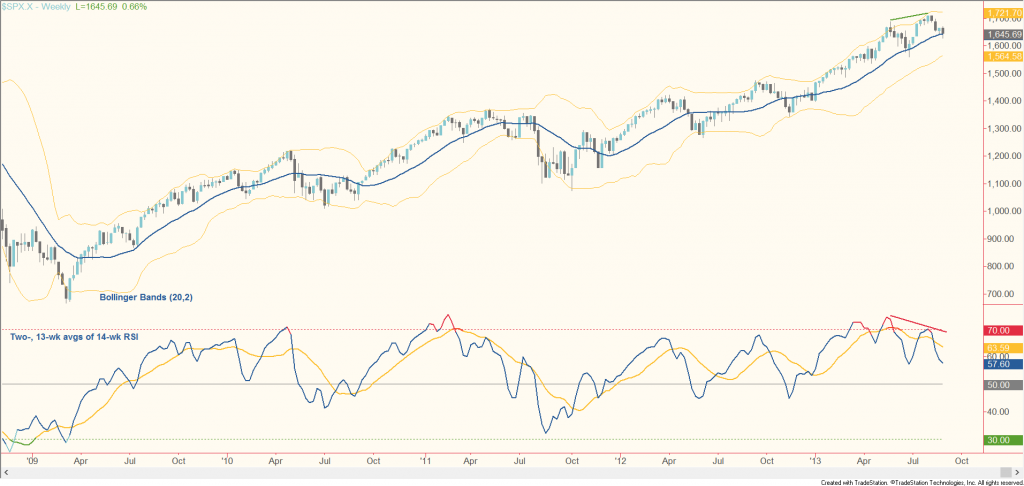
 Putting aside the news and “instant analysis” that you just can’t miss, the S&P 500 weekly chart shows an attractive long entry scenario and reasons to buy the dip. I believe position traders (2- to 12-week time horizon) should be looking for what to buy and taking action some here. At miAnalysis.com, my focus is first on identifying all the equity-related ETFs that show a history of outperforming the S&P 500 and are trending well, and second on determining which candidates show the most compelling chart structures that are worth acting on.
I base my reasoning on a simple Buy At Mean set-up on the weekly chart. In uptrends, markets tend to extend gains during impulse phases in which progress is made, and revert to the mean (defined by the 20-week simple moving average) after price has gone beyond what fundamentals justify and short-term traders take profits on long positions. After a reversion to the mean – through a pullback or consolidation – the market is at a natural place to resume the larger uptrend, producing a buy the dip scenario. Granted, this pattern isn’t perfect. Some pullbacks go beneath the mean, even down to the lower Bollinger Band (two standard deviations below). But you never get a free lunch in trading: stop losses can be placed beneath 1627.5 – the Wednesday low and what will likely end up being the low of the week.
S&P 500 Weekly Chart
Keep in mind this probably isn’t the time to feel complacent about being long. A bearish momentum divergence between price and the fast average of RSI on the weekly chart tells us the pace of the advance is slowing (even without the indicator, you can see this in how little headway was made above the May high before price came back down in August). I often base my exit strategy for position trades on a downturn in the 20-week moving average, but in this case I’ll be advising miAnalysis clients to be a little quicker to take profits if the market does indeed recover in the coming weeks. Finally, although it’s a good time to buy the dip, it’s likely not a good time to push your luck.
Thanks for reading. My best, everyone, Chris Burba.
Twitter: @ChrisBurbaCMT
Chart Source: TradeStation
No position in any of the securities mentioned at the time of publication. Any opinions expressed herein are solely those of the author, and do not in any way represent the views or opinions of any other person or entity.


