Mid-cap stocks have been underperform large-cap stocks for quite some time.
Perhaps, this is a reason for the malaise in the broader market over the past year.
Let’s take a closer look at what’s happening.
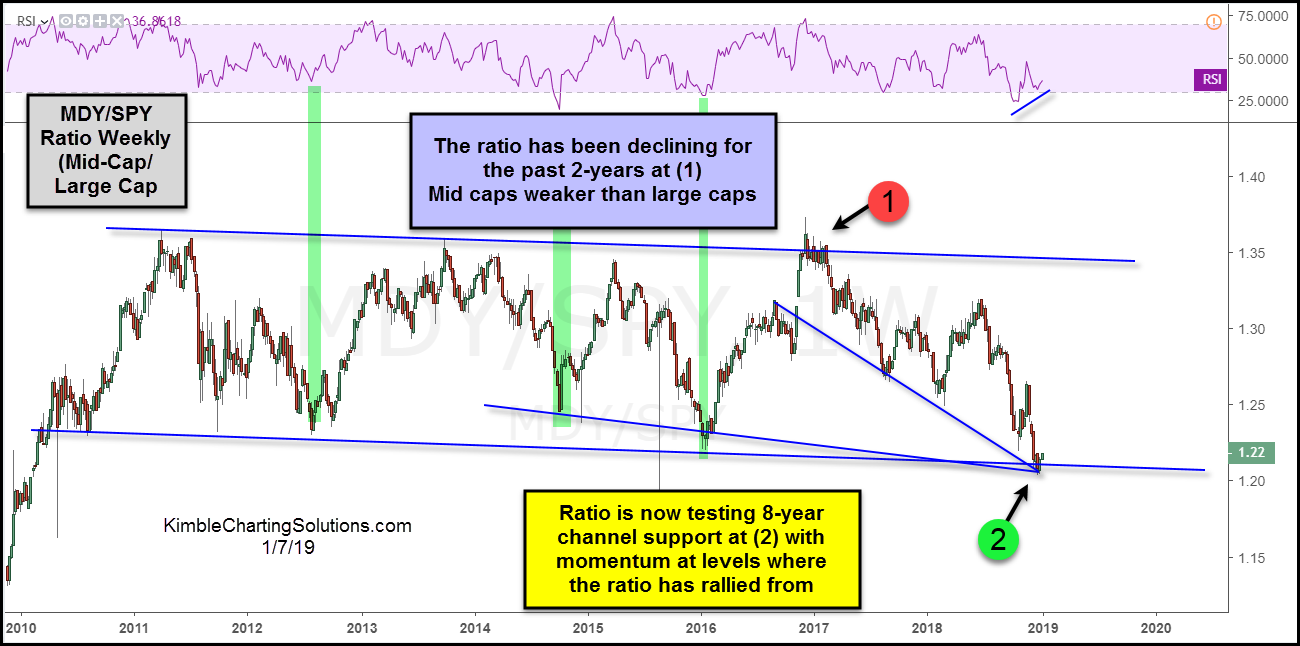
In the chart below, we look at the performance ratio of mid cap stocks to large cap stocks, using the S&P Mid Cap ETF (MDY) and the S&P 500 (SPY).
As you can see, it’s been trading in a longer term channel and hit upside resistance in late 2016 / early 2017 at (1). And it has been heading lower ever since.
The decline is currently testing 8-year support (2) with momentum levels oversold and potentially creating a higher low. Mid caps have rallied from these momentum levels in the past (see green markers).
A setup is in play for Mid-cap stocks to outperform Large-cap stocks. Stay tuned!
Mid-Cap Stocks (MDY) / Large-Cap Stocks (SPY) Ratio Chart
Note that KimbleCharting is offering a 2 week Free trial to See It Market readers. Just send me an email to services@kimblechartingsolutions.com for details to get set up.
Twitter: @KimbleCharting
Any opinions expressed herein are solely those of the author, and do not in any way represent the views or opinions of any other person or entity.


