The market did exactly what we thought it would do given the blog from February 25th when I observed a, “Nasty Potential Topping Pattern in the Four Indices.”
From there, we examined the Transportation Sector IYT, which failed the 50-week moving average after two weeks trading above it.
We compared IYT to the Russell 2000 IWM, which after two weeks above its 50-WMA, failed it this week thus following IYT’s lead.
Last night, I queried on whether RIP is the new ETF?
Which brings us today.
Draghi and the U.S. Federal Reserve announced indefinite low interest rates with the possibility of more Quantitative Easing.
While rates fell, the U.S Dollar got stronger. The flight to the U.S. Dollar as a safety play makes sense when one compares the US economy to the global economy.
The U.S. is better off. For now.
But I wonder, considering the market fell regardless of Draghi and the Fed, how long can the dollar hold up?
I thought now a good time to look again at what commodities might do from here.

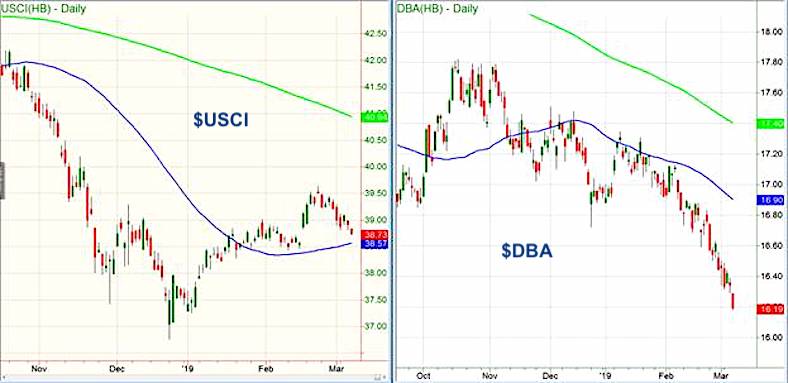
On the left is the U.S. Commodity Index and on the right the Invesco DB Agricultural Fund.
Remember that historical low ratio between equities and commodities?
Clearly it’s narrowed. But only because equities are down from their all-time highs.
Commodities are still so cheap.
Take these commodity ETFS:
USCI represents a basket of metals, oil, ags, and softs.
Agriculture ETF (NYSEARCA: DBA) sticks to corn, wheat, beans, sugar, coffee and cotton.
US Commodity Index (NYSEARCA: USCI) is holding the 50-DMA thus far. As I featured this ETF a while back, the risk to the 50-DMA has decreased significantly.
I’m not recommending buying against the 50-DMA today. But, I do believe that a move back over 39.00 would indicate perkiness.
On the other hand, DBA looks abyssmal right now.
Today’s low was 16.18. In fact, a new all-time low. A lot has to do with the lack of a trade deal.
For a technical signal that the bottom is in, I’d wait for a close over 16.72, or the low from the week of 12/28/18.
That was the last time we saw any real buying come in.
S&P 500 (SPY) – 276.84 broke early. Which took this down to the 200-DMA. That makes 274.83 the closing level to hold or not
Russell 2000 (IWM) – 153 now resistance. 150.95 the weekly EMA support to hold
Dow (DIA) – 251.28 the 200-DMA 256.20 resistance this would have to clear and close above
Nasdaq (QQQ) – My dear NASDAQ bulls, the bigger they are, the harder they fall. 170.58 the 50-WMA to hold or not with 172.29 the 200 DMA pivotal resistance.
KRE (Regional Banks) – 54.21 the pivotal weekly EMA for the close tomorrow
SMH (Semiconductors) – 100.50 is where its best support sits-or at its 50-WMA. Back over 102.50 a relief
IYT (Transportation) – 183.50 pivotal for tomorrow and the close-otherwise we see 181.50 area next
IBB (Biotechnology) – The long and often wrong public selling here. 108.82 the weekly EMA support and if can get back above and close over 110-way better
XRT (Retail) – Sitting right on its 200-WMA at 4.60-make or break
Twitter: @marketminute
The authors may have a position in the mentioned securities at the time of publication. Any opinions expressed herein are solely those of the author, and do not in any way represent the views or opinions of any other person or entity.


