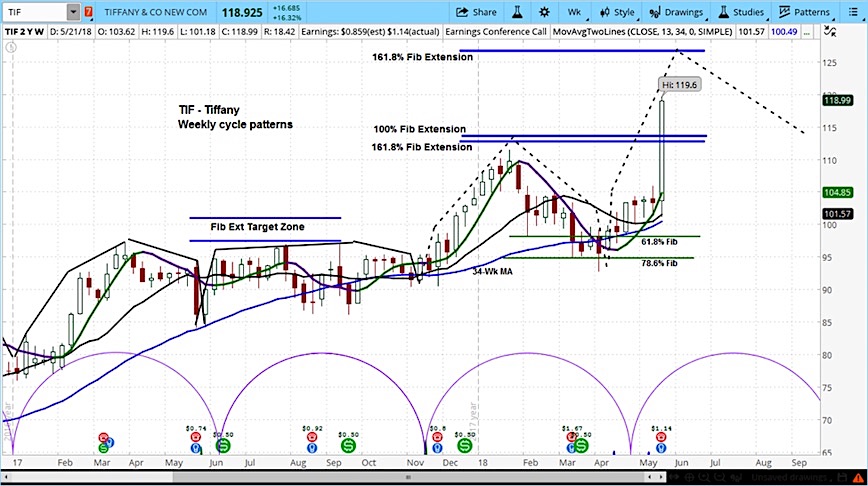
Tiffany & Company (TIF) traded 16% higher on Wednesday morning, after reporting earnings that beat Wall Street estimates.
The company reported earnings per share of $1.14 and total revenue of $1 billion, far exceeding analyst expectations of $0.83 and $958 million.
For the fiscal year, Tiffany now projects earnings of $4.50 to $4.70, which are above the range of expectations of $4.25 to $4.45.
Upon reviewing the chart for TIF, the stock is in the rising phase of its current market cycle. It has soared past the resistance level marked by the 100% fibonacci extension.
However, it may now be overbought.
The next level is the 161% extension, which is around $126. For an introduction to market cycles, check out our Cycle Analysis course.
Tiffany & Company (TIF) Stock Chart with Weekly Bars
Twitter: @askslim
Any opinions expressed herein are solely those of the author, and do not in any way represent the views or opinions of any other person or entity.


