Another look at market volatility that will leave you scratching your head
In this article I look at an alternative view of volatility, and it’s a view that frankly has me scratching my head…
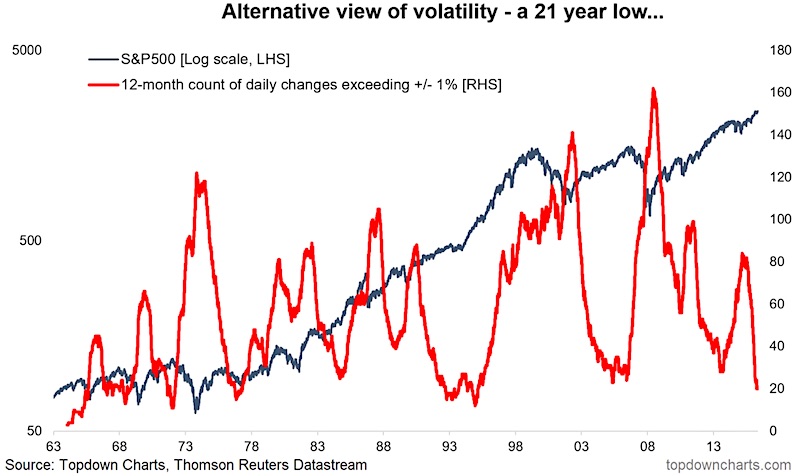
The chart appeared in a recent edition of the Weekly Macro Themes report in which we talked about the VIX Volatility Index (INDEXCBOE:VIX) and why volatility is so low and how a low VIX and low volatility does not necessarily mean low risk…
But this particular chart shows what is in essence a market regime switch from high volatility to low volatility.
The red line is basically an alternative volatility indicator. It is a rolling 12-month count of the number of days where the 1-day % change was greater than 1% or less than -1%… i.e. a move in either direction exceeding 1%. The blue line is the S&P 500 Index (INDEXSP:.INX). The bottom line is that it has fallen to about a 21-year low.
That’s the easy part.
The hard part is the interpretation… We know that periods of extreme high or low volatility seldom last. And that low volatility is often a good predictor of future higher volatility, and high volatility is often a good predictor of future lower volatility.
ALSO READ: The Last Time This Happened Global Equities Corrected
This rings more or less true for this indicator. The trouble comes when you overlay that with market price. Most of the time spikes in volatility on this indicator occur during a market bottom, but there are exceptions e.g. the dot-com mania, and the late 70’s/early 80’s.
So you can say the volatility rises into a market correction/bear market, but it can also rise in a more manic and frenzied bull market like the dot-com boom.
The other point is that low volatility can take some time to pass e.g. the extended low vol patch in the early 90’s and mid 2000’s.
Thus we’re left with a conclusion that says where the indicator is currently at is remarkable and unusual, but what may come next, based on history, could just as easily be a bear market or a more frenzied bull market. Let me know your take in the comments or over on Twitter.


