For the past several weeks, I have been honing in on an important stock market ratio / indicator. This indicator is the ratio performance of the Consumer Staples (NYSEARCA:XLP) to the NYSE Composite Index (INDEXNYSEGIS:NYA).
I’ve covered this ratio and its importance as a stock market indicator several times before. Here’s my latest article on this ratio.
Today I am focusing on this indicator because the last time it looked like this, we saw a 20+ percent correction.
So let’s review what’s happened / is happening on the XLP/NYSE market ratio. Could this stock market correction indicator trigger again?
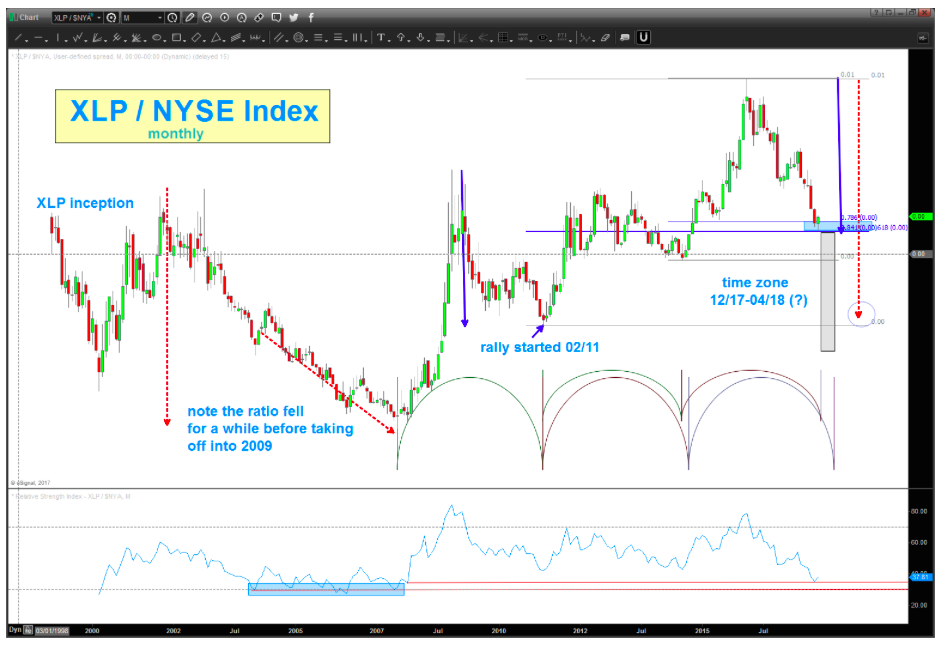
- Ratio is not quite “there” yet on timing basis, so we might see more back and filling.
- Measured move price correction (the largest 2009).
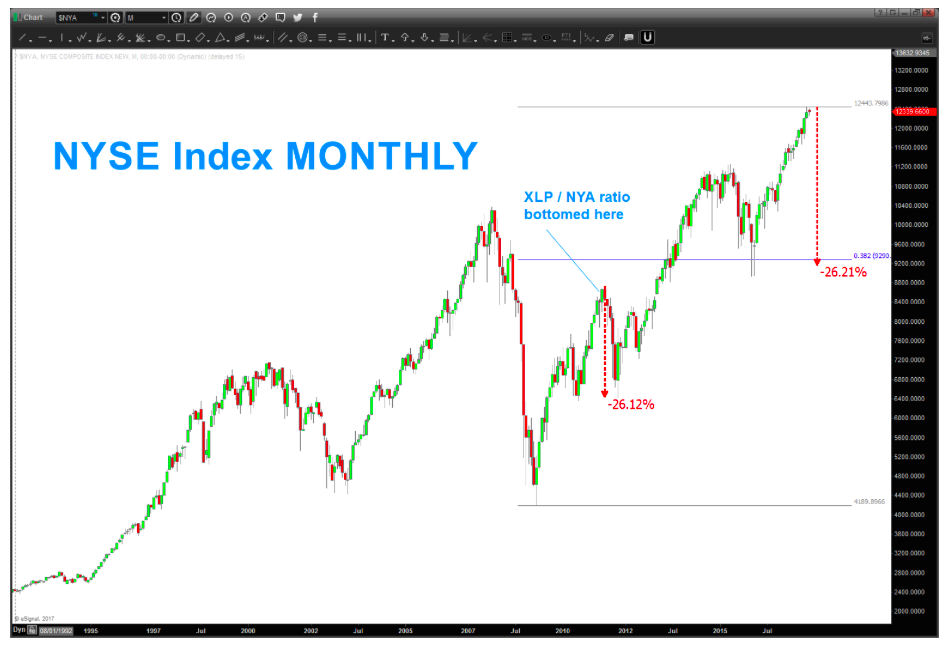
- The previous indicator produced a 20 percent correction on the NYSE Composite.
- The Relative Strength Indicator (RSI) is at the low end of the range. It can hang here for a while before seeing a big move… it did this in 2000.
- Note the NYSE Index sold off more than 20 percent AFTER it bottomed (a delay).
In any event, this ratio is in (or nearing) the zone, so put it on your radar.
XLP/NYSE Index Ratio Chart – stock market correction indicator?
NYSE Composite Index Chart
Thanks for reading.
Twitter: @BartsCharts
Author does not have a position in mentioned securities at the time of publication. Any opinions expressed herein are solely those of the author, and do not in any way represent the views or opinions of any other person or entity.

: Showing Some Signs of Emerging Strength")

