The Value Line Geometric stock index (NDEXNYSEGIS) contains approximately 1,675 companies from the NYSE Exchange, American Stock Exchange, Nasdaq and over-the-counter market.
In this post, we will be focusing on the Value Line Geometric Index (the original equally-weighted index), which provides a very broad measure of the stock market’s health, well beyond the S&P 500 Index (INDEXSP:.INX).
The question up for discussion: Is a new bull market underway?
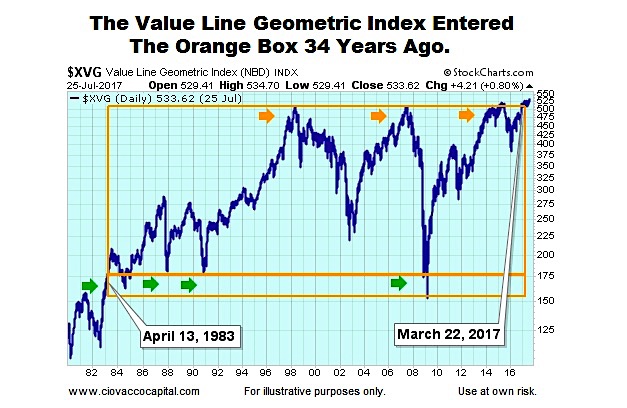
The Average Stock Just Broke Out Of A 34 Year Box
The Value Line Geometric Index recently cleared an area where price had been previously rejected on three separate occasions (see orange arrows).
Consolidation Means Little To No Progress
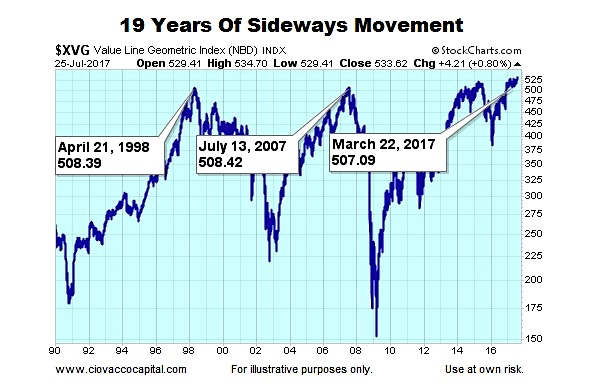
Drawing a consolidation box involves some degree of subjectivity. However, there is nothing subjective about horizontal lines that show price in the same place in 1998, 2007, and 2017. We could draw a simple horizontal line on the chart below at 508 and the line would hit price in 1998, 2007, and again in 2017.
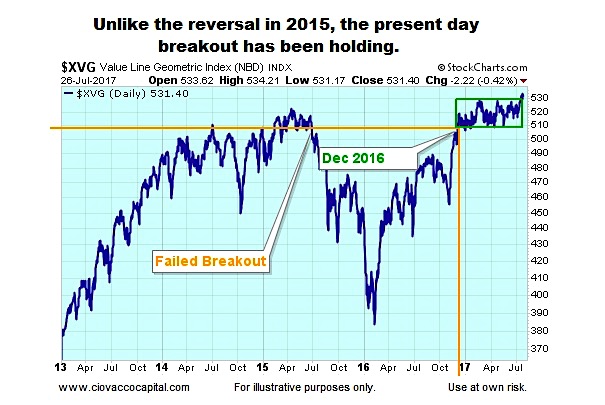
The Recent Bullish Breakout Is Holding
As shown in the zoomed-in version of the same chart below, since breaking out in 2016, the bias has been to hold above the previous area of long-term resistance, which dates back to 1998.
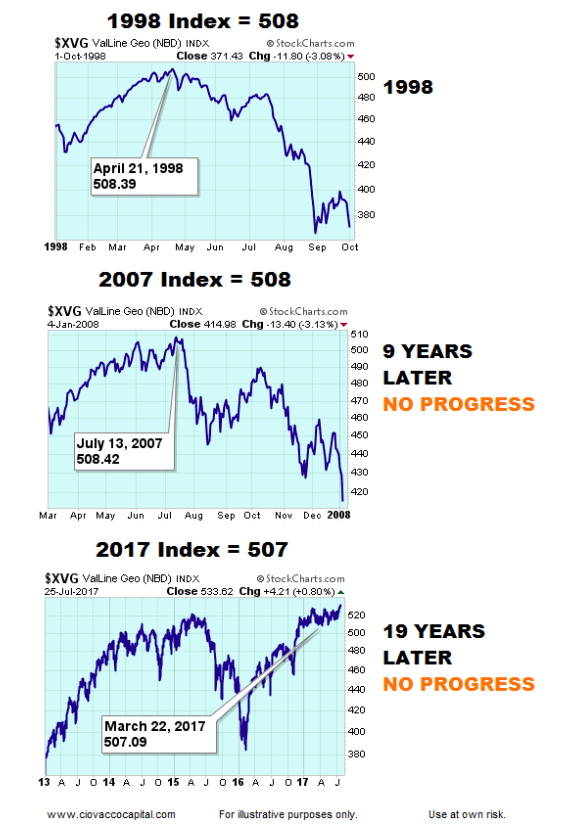
The Average Stock Made Zero Progress For 19 Years
If we take a closer look at the Value Line Geometric Index in 1998, 2007, and 2017, it is easy to see the average stock went nowhere for 19 years. This means the average stock has been treading water (consolidating) for 19 years. The charts shown below represent the top of the 34-year consolidation box (1983-2017).
Continue reading this article on the next page…


